
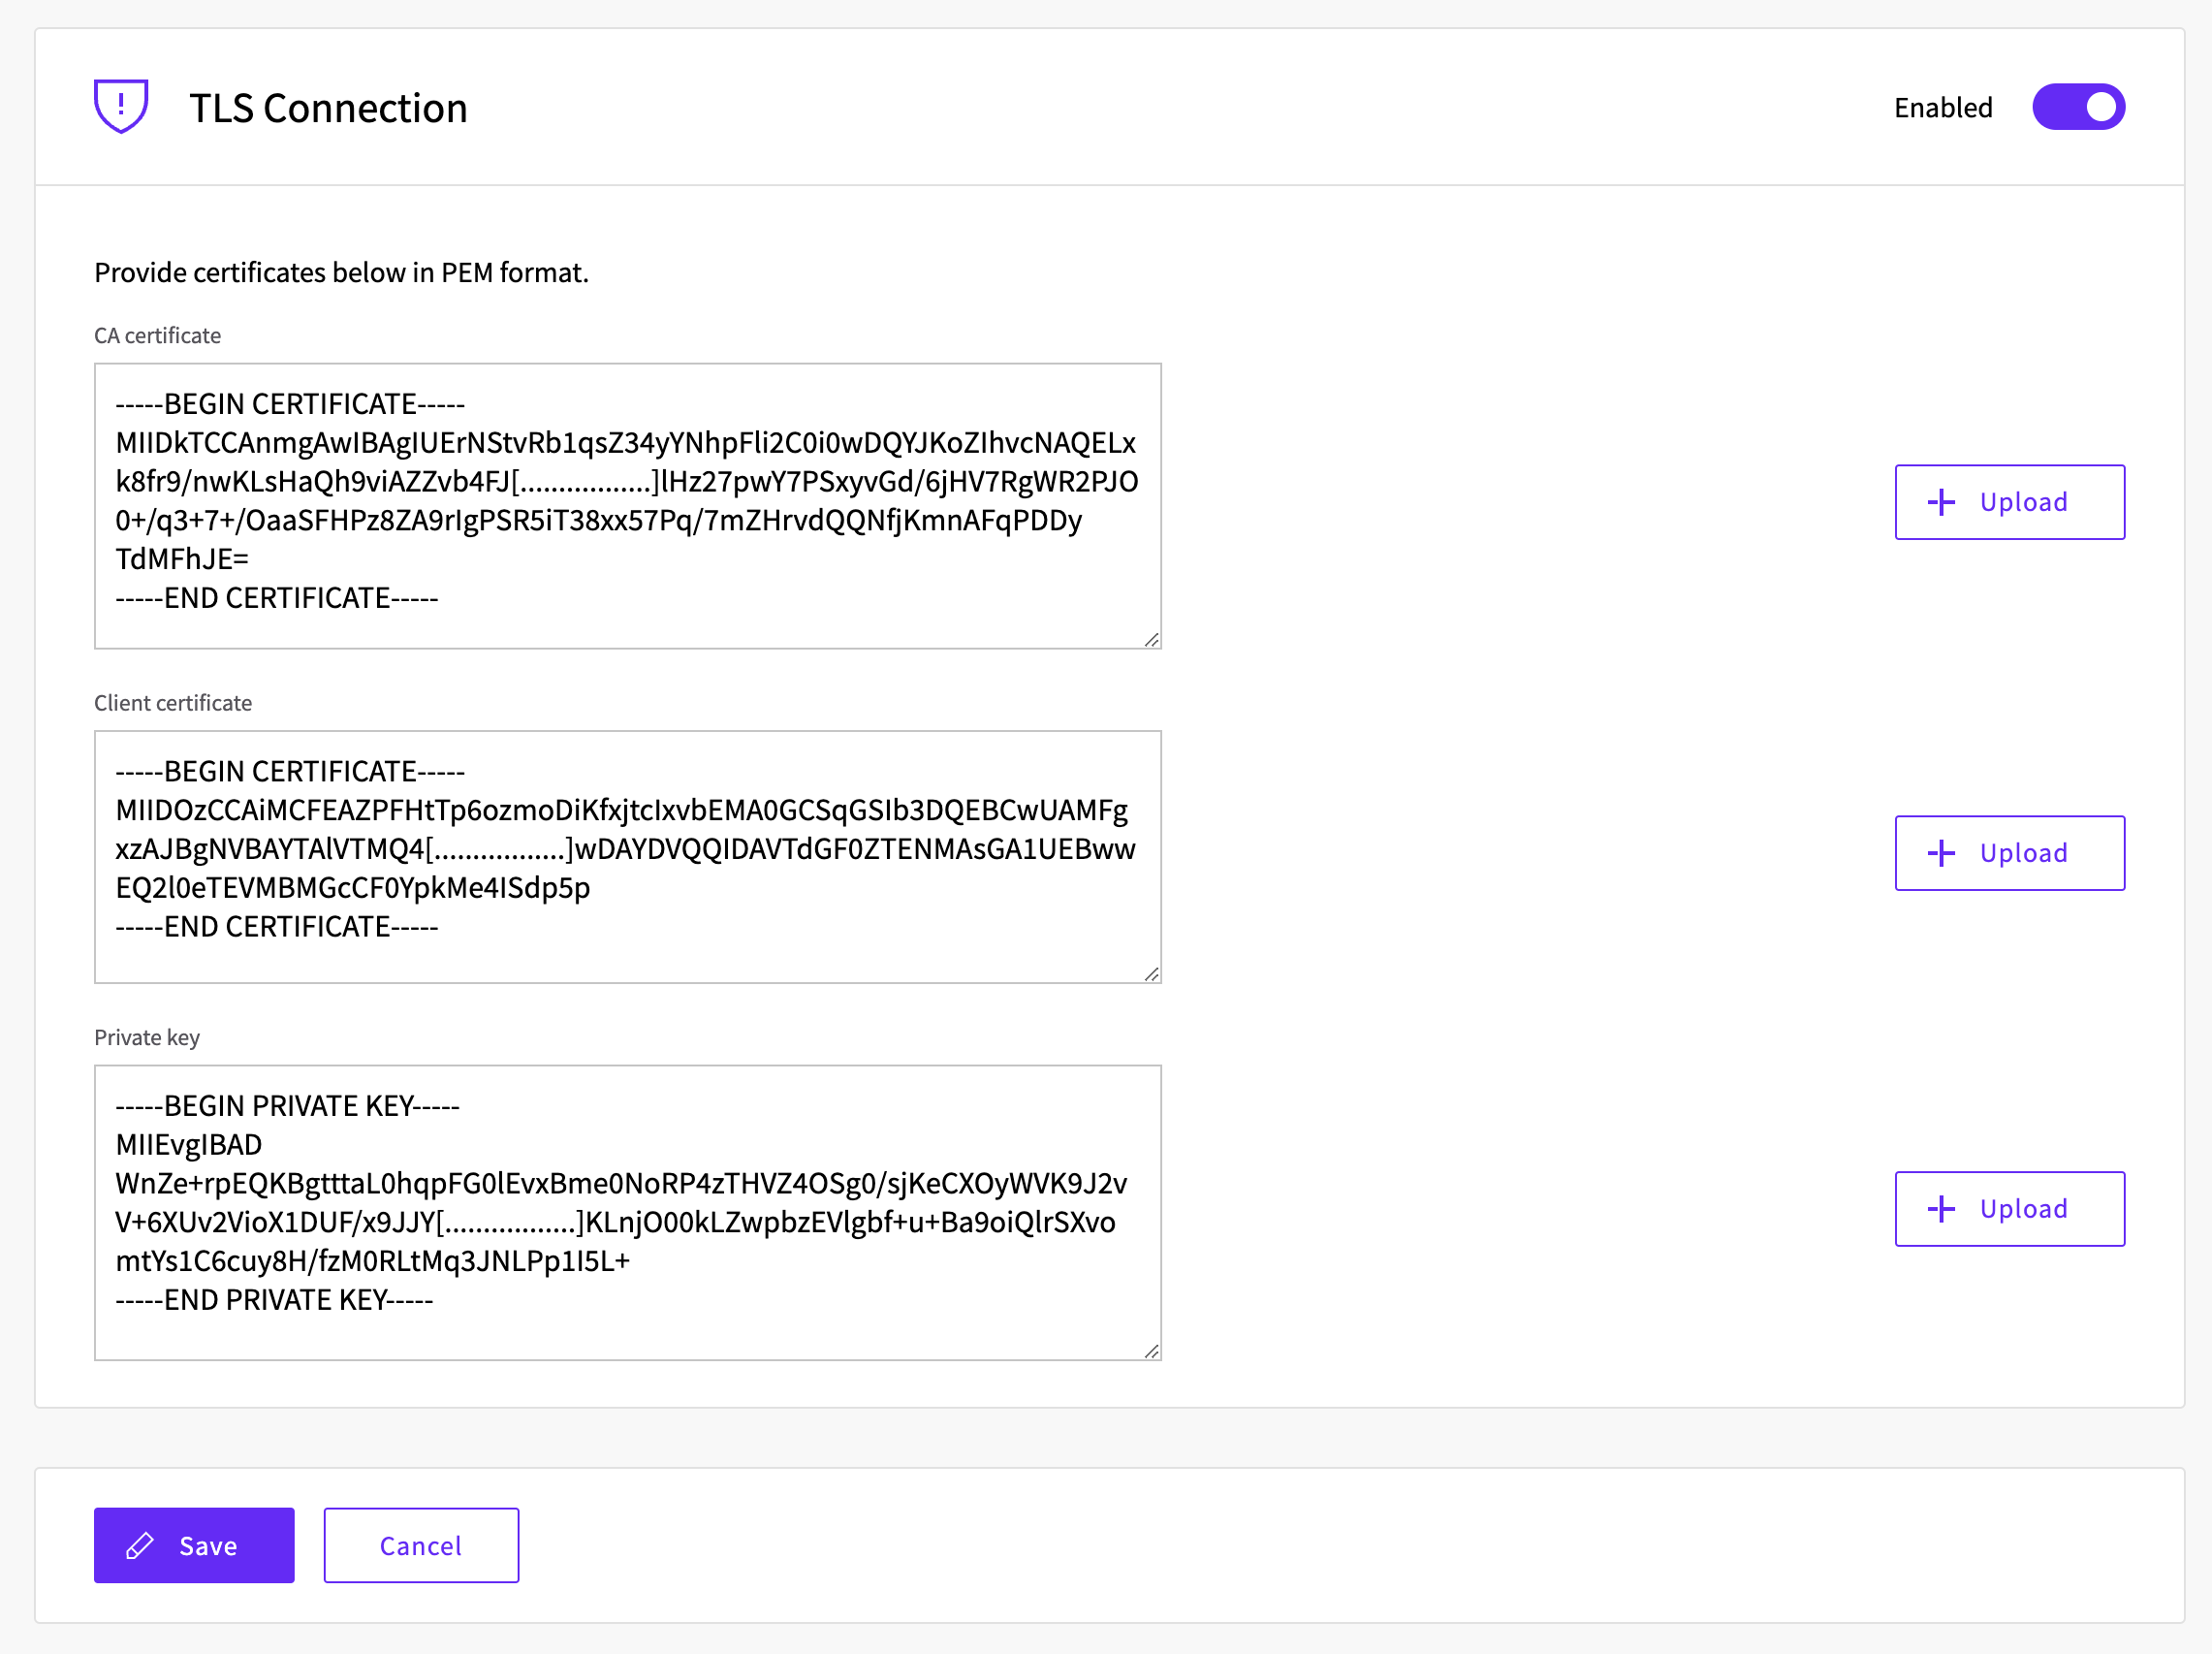
When copying certificates and private key, include the BEGIN and END markers (including dashes) as they are important parts of the certificate formatting.
How to export Managed Database logs to OpenSearch and Rsyslog
The Managed Database Integration feature allows you to securely transfer system-level service logs from your UpCloud Managed Databases to various destinations for real-time processing and monitoring.
This integration offers several benefits. It improves log searchability and allows for time-based navigation, making it easier to troubleshoot database issues. By centralising your logs, you gain better insights into your database operations and enhance overall system observability.
You can send Managed Database logs to an existing UpCloud OpenSearch Managed Database or an Rsyslog server.
In this guide, we'll show you how to set up both OpenSearch and Rsyslog integrations, so you can monitor and manage your database logs.
OpenSearch
OpenSearch is a powerful search and analytics platform that enables you to store, search, and analyse large volumes of data in real-time. It is especially useful for centralising logs from multiple sources, providing advanced search capabilities, data visualisation, and alerting features. With OpenSearch, you can easily monitor your database logs, create custom dashboards, and gain valuable insights from your log data.
Creating the integration for OpenSearch
Before you begin, ensure you have an existing UpCloud OpenSearch Managed Database set up, as this is needed for the integration.
Start by opening the Managed Database from which you wish to export the logs - this can be any Managed Database. Then, click the Create database integration button under the Logs tab.
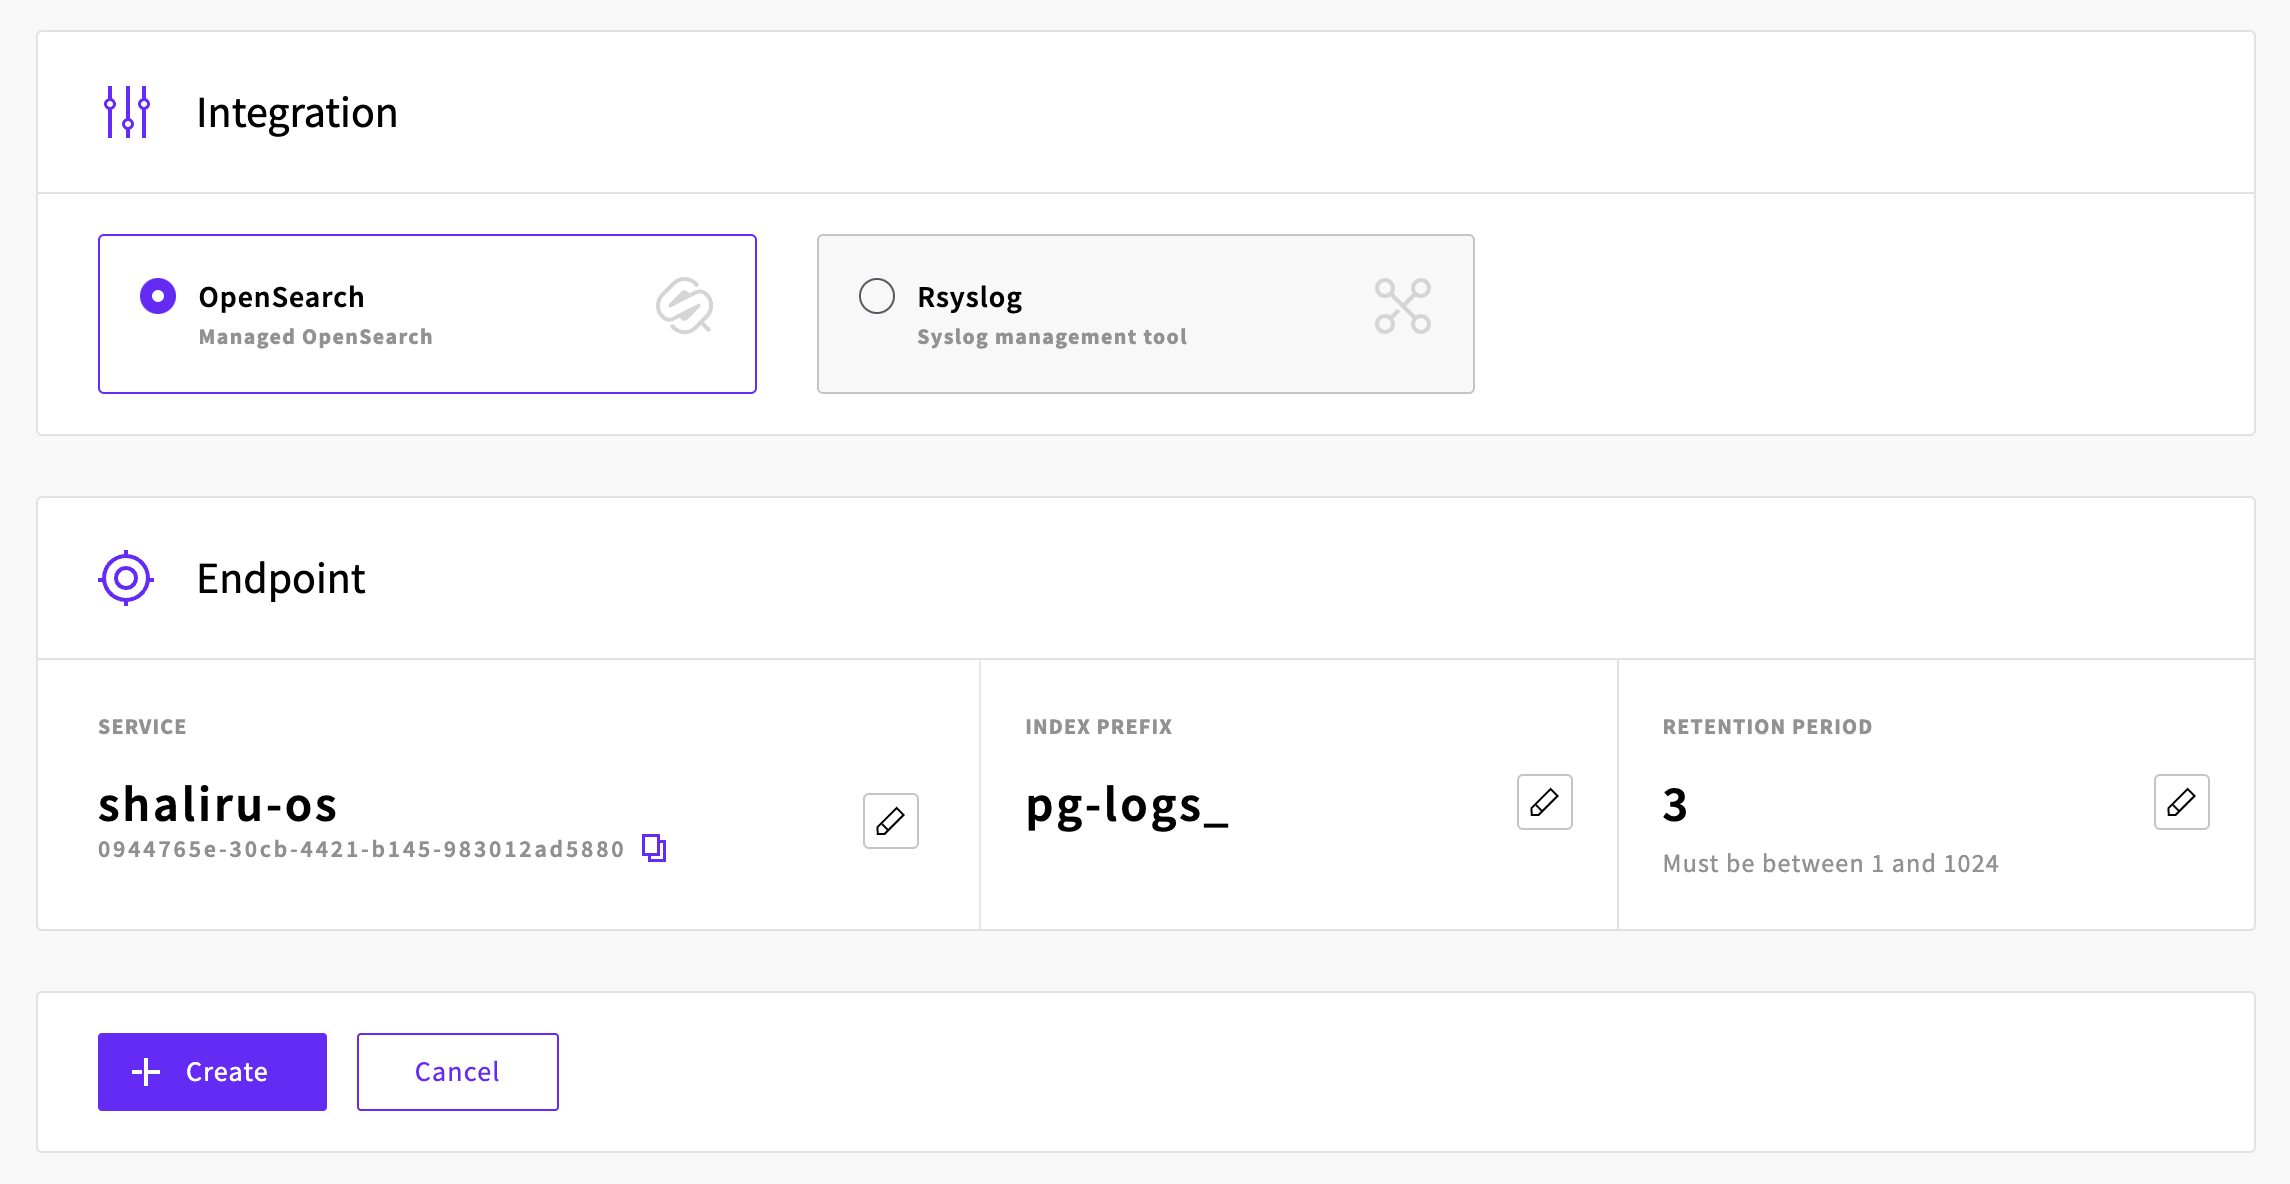
- Select OpenSearch as the integration type.
- In the Endpoint section, click the pencil icon under Service, and choose your existing UpCloud Managed OpenSearch database from the drop-down list.
- Replace
myprefix_with a prefix of your choice. This prefix will help you easily identify and match your indices when creating an index pattern later in OpenSearch. - Select a retention period in days. This defines how long you want to keep the logs before they are replaced by newer copies.
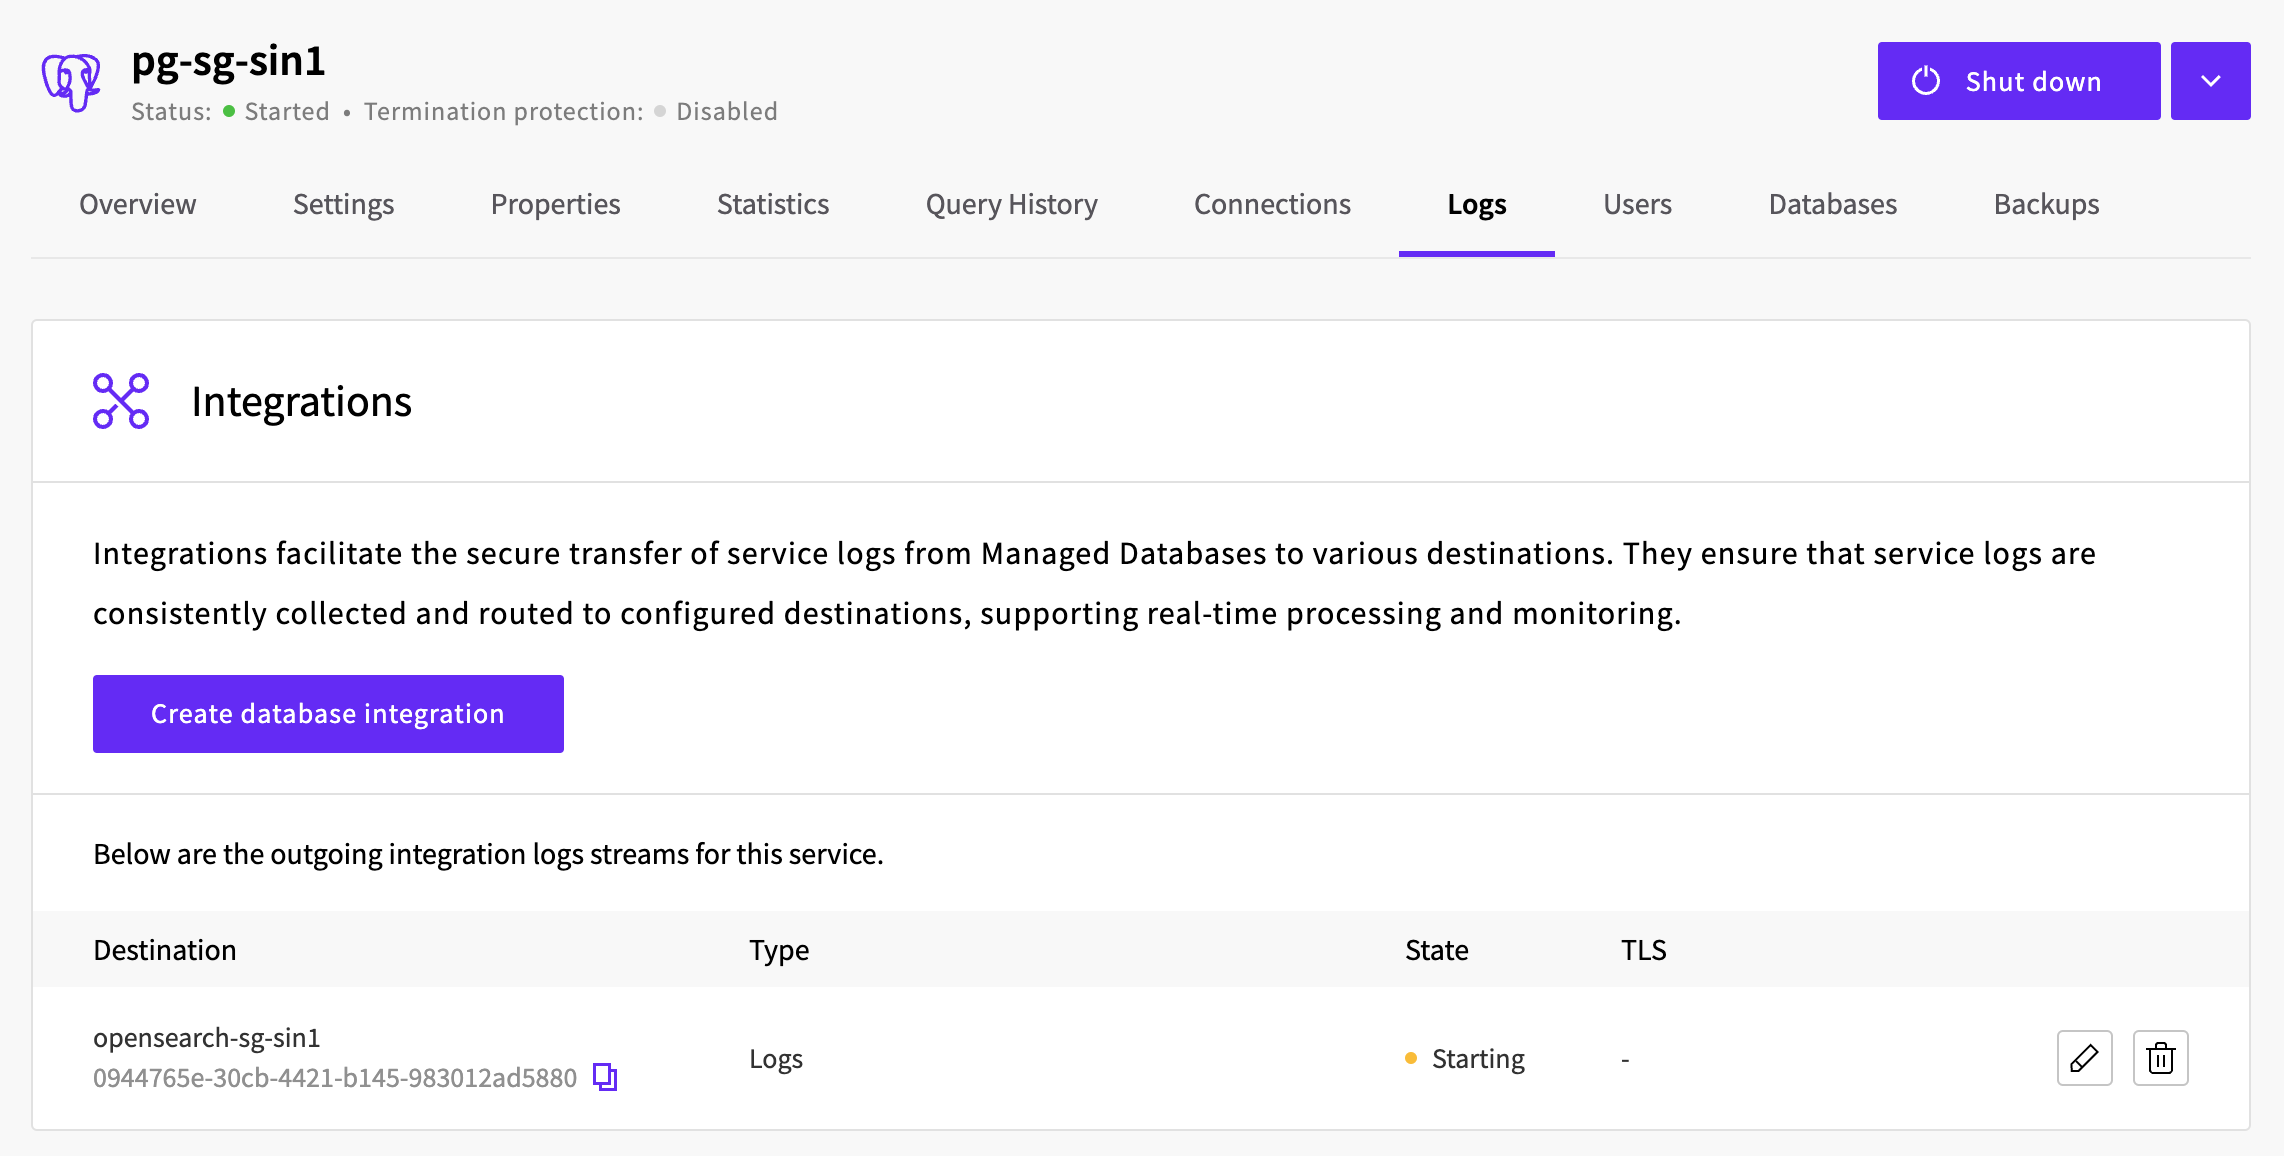
The integration has now been created, and the service logs from your UpCloud Managed Database will be streamed in real-time to your OpenSearch database.
Understanding index creation and retention
The logs for each day will be saved as an index file in the format <prefix>-YYYY-MM-DD, where <prefix> is the prefix you specified in step 3 above.
The total number of indices will depend on the retention period you set. For example, setting a retention period of three days means you will always have three indices holding logs for the last three days. On the fourth day, the log for the first day will be deleted and replaced with the new log from that day.
Accessing OpenSearch Dashboard
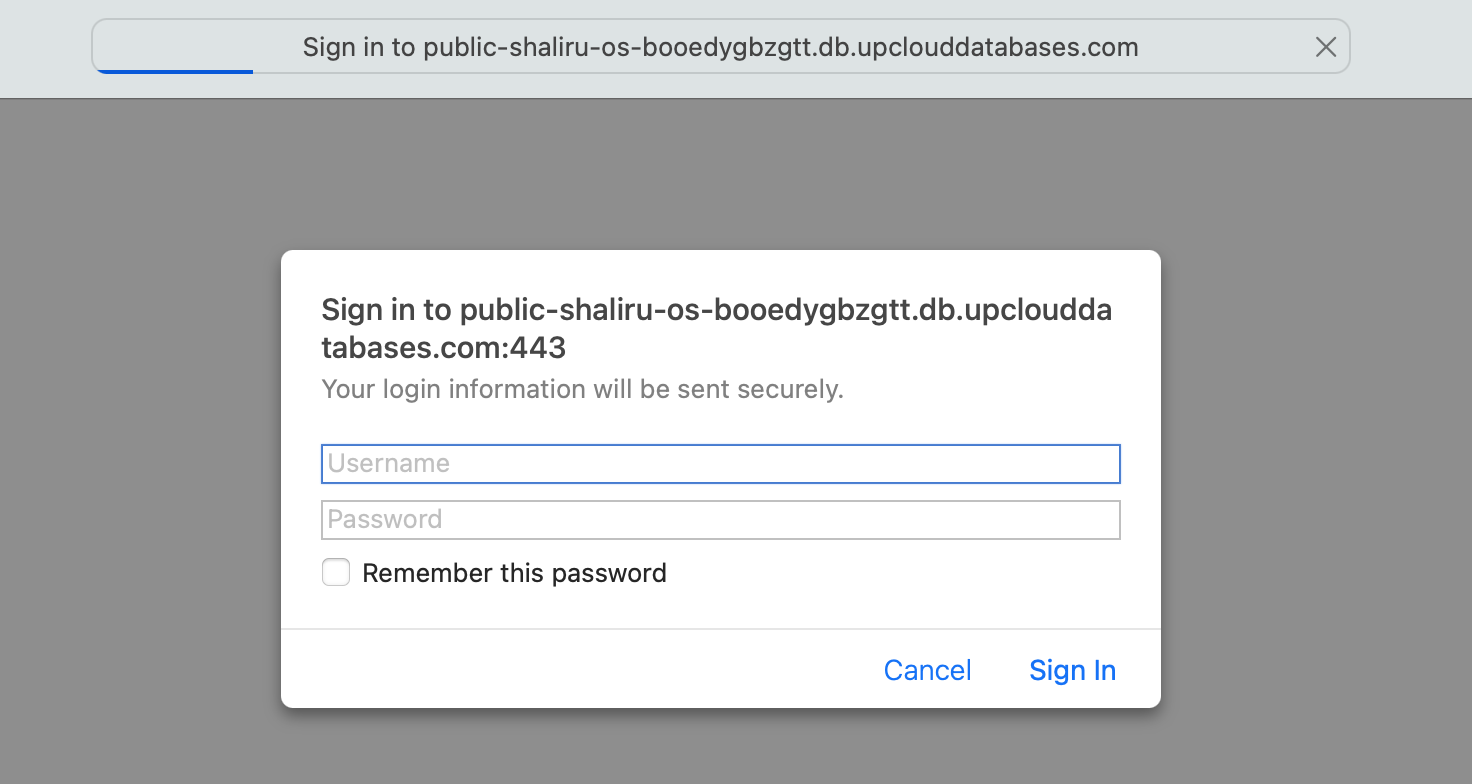
To view these logs, go to your OpenSearch database and click the Go to dashboard button. This will open the OpenSearch dashboard, where you will be prompted for a username and password.
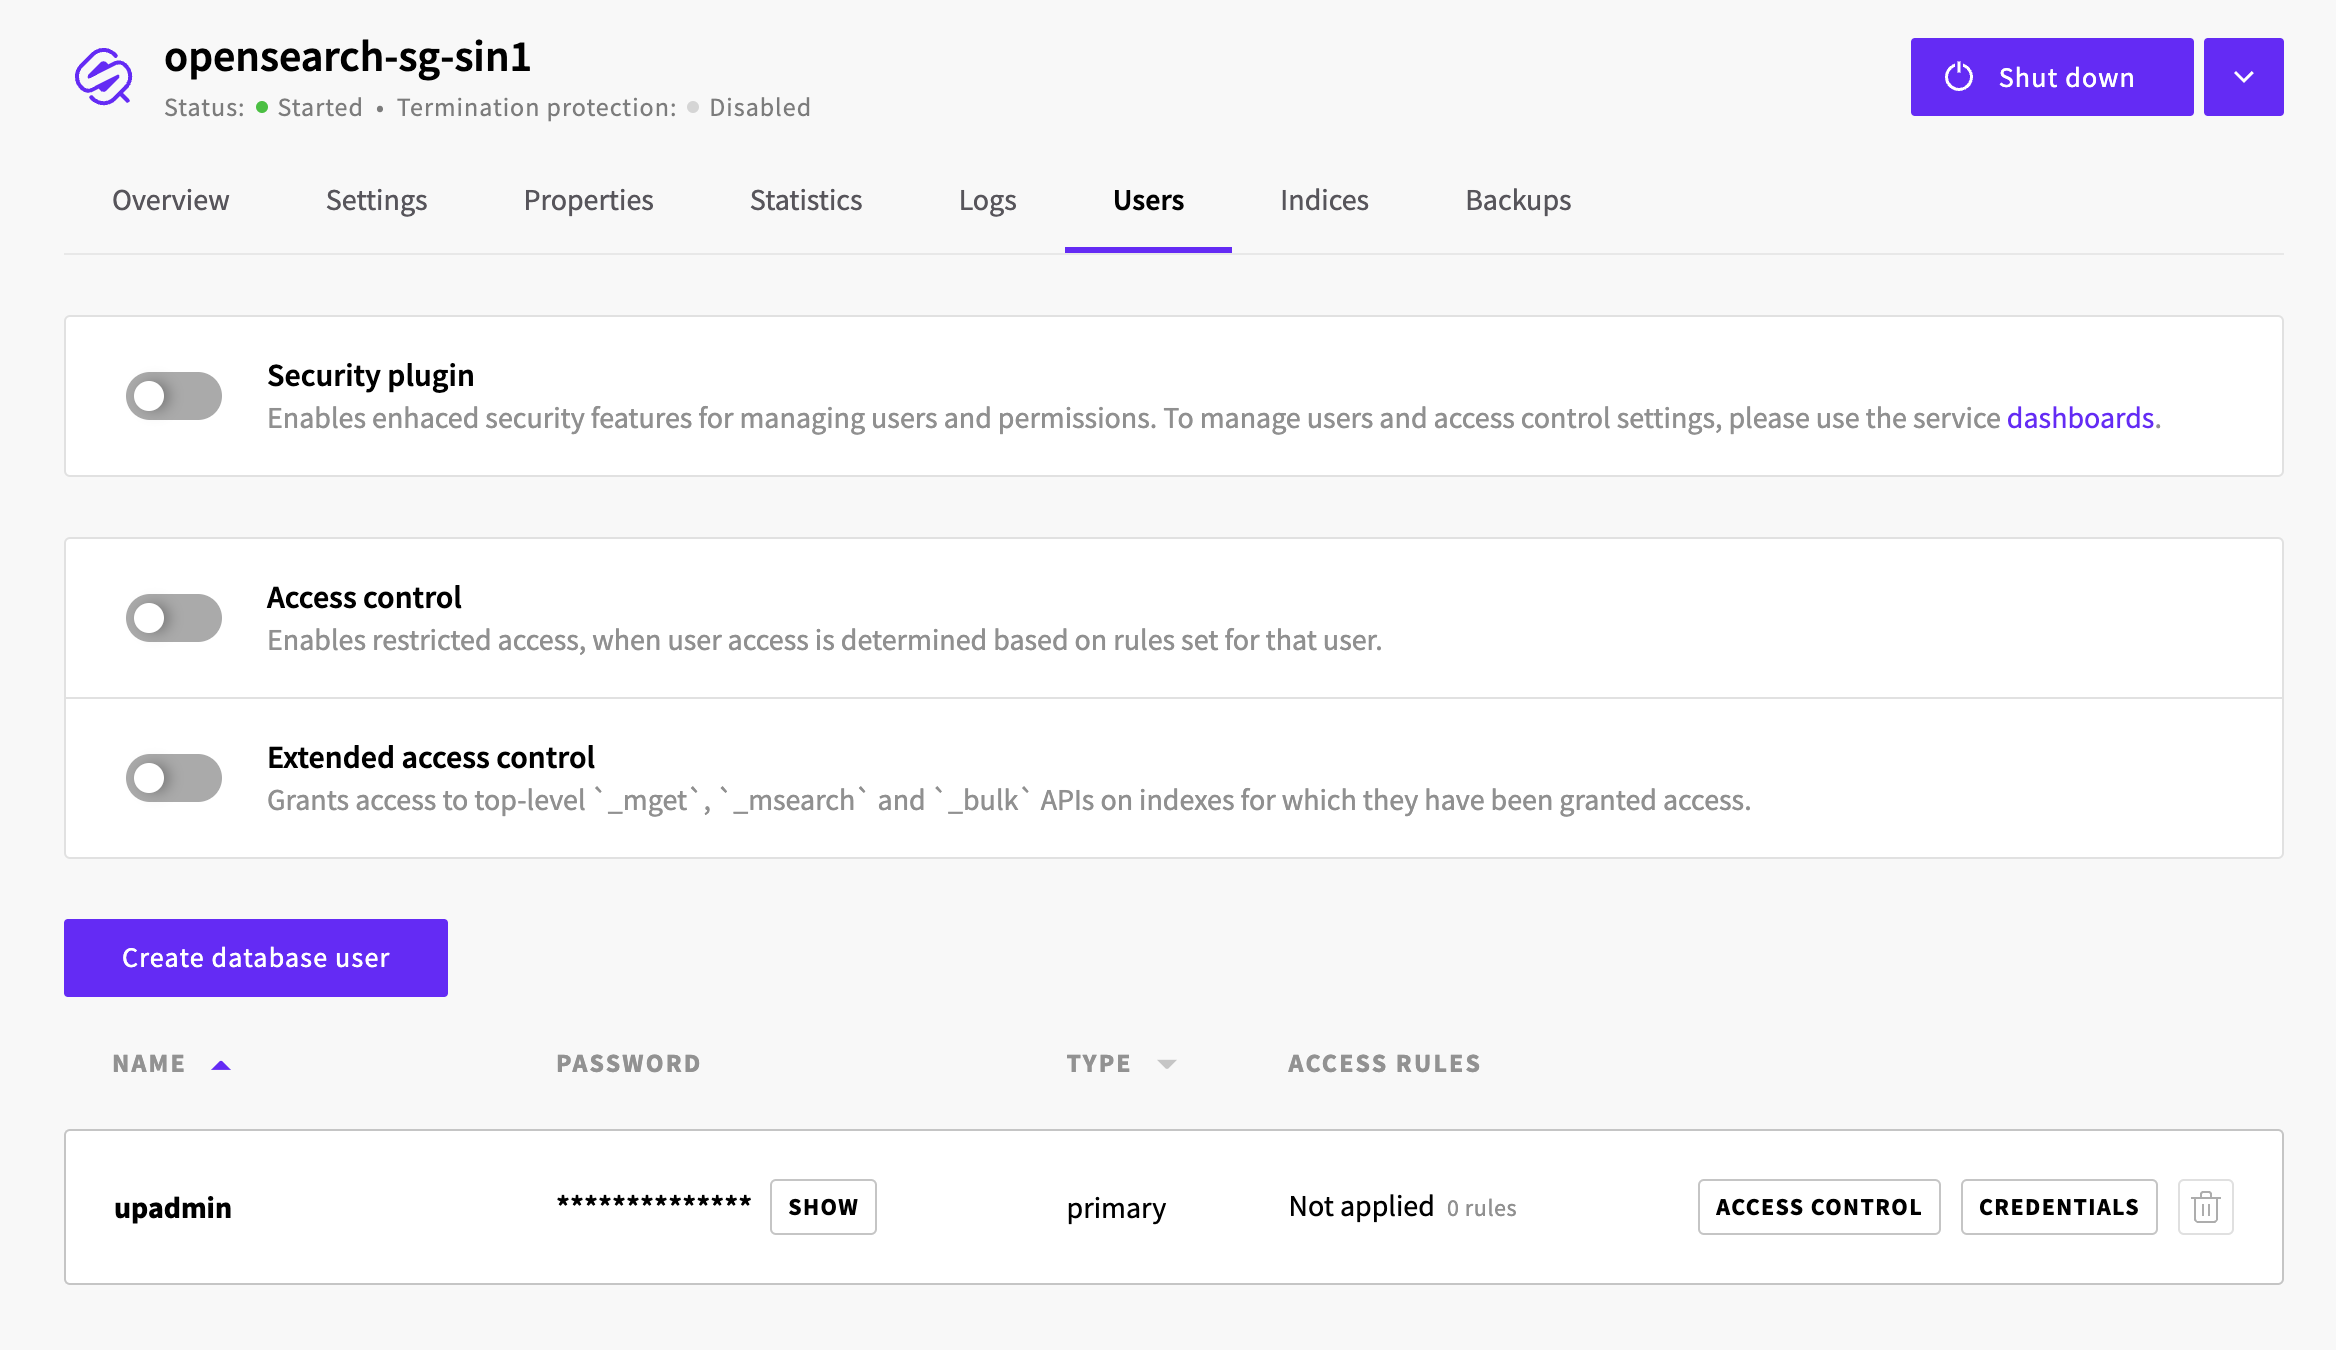
You can find your OpenSearch credentials under the Users tab on your OpenSearch page.
Creating an index pattern
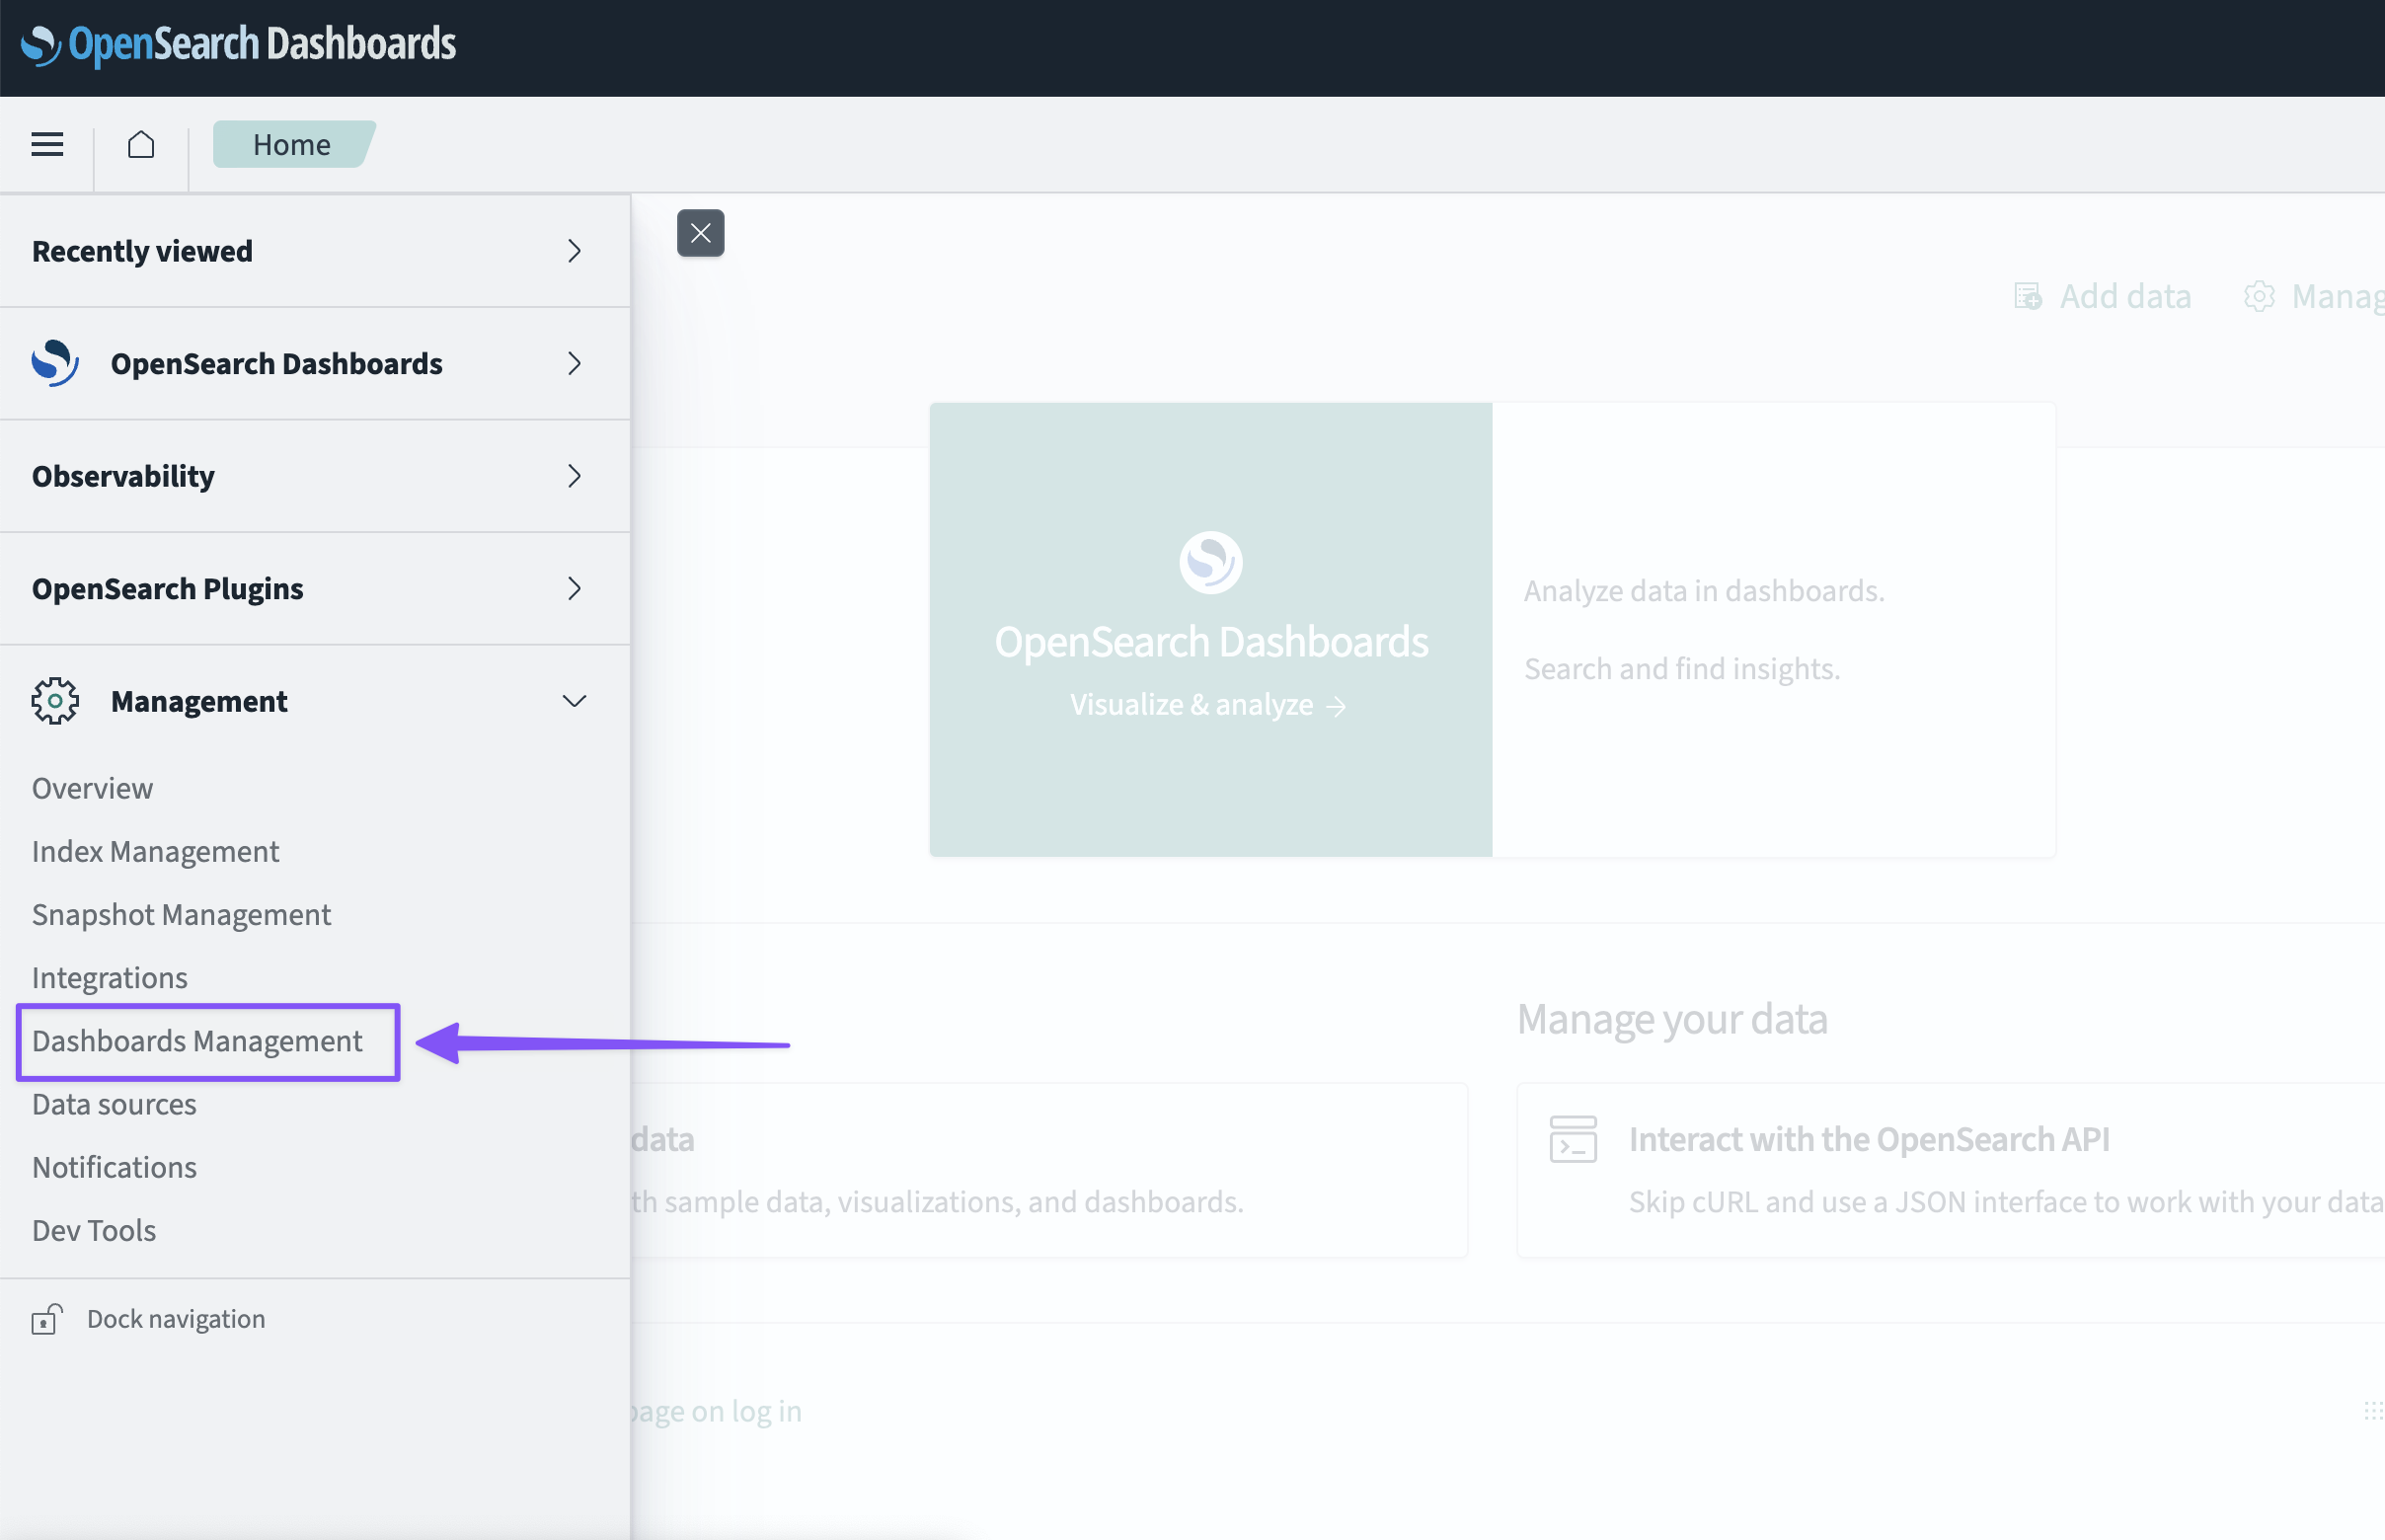
After logging in, open the menu by clicking the burger icon. Under the Management section, click Dashboards Management.
From the next set of options, click Index Patterns, and then click Create index pattern.
On the first screen of the index pattern creation process, select Use default data source, then click Next.
On the next screen, you’ll need to define an index pattern that matches the indices where your logs are stored. This is where setting an appropriate prefix comes in handy. You can enter a pattern that matches all indices beginning with your chosen prefix. For example, if you used a prefix of pg-logs_, you can enter pg-logs_* as your index pattern to match all indices that start with this prefix.
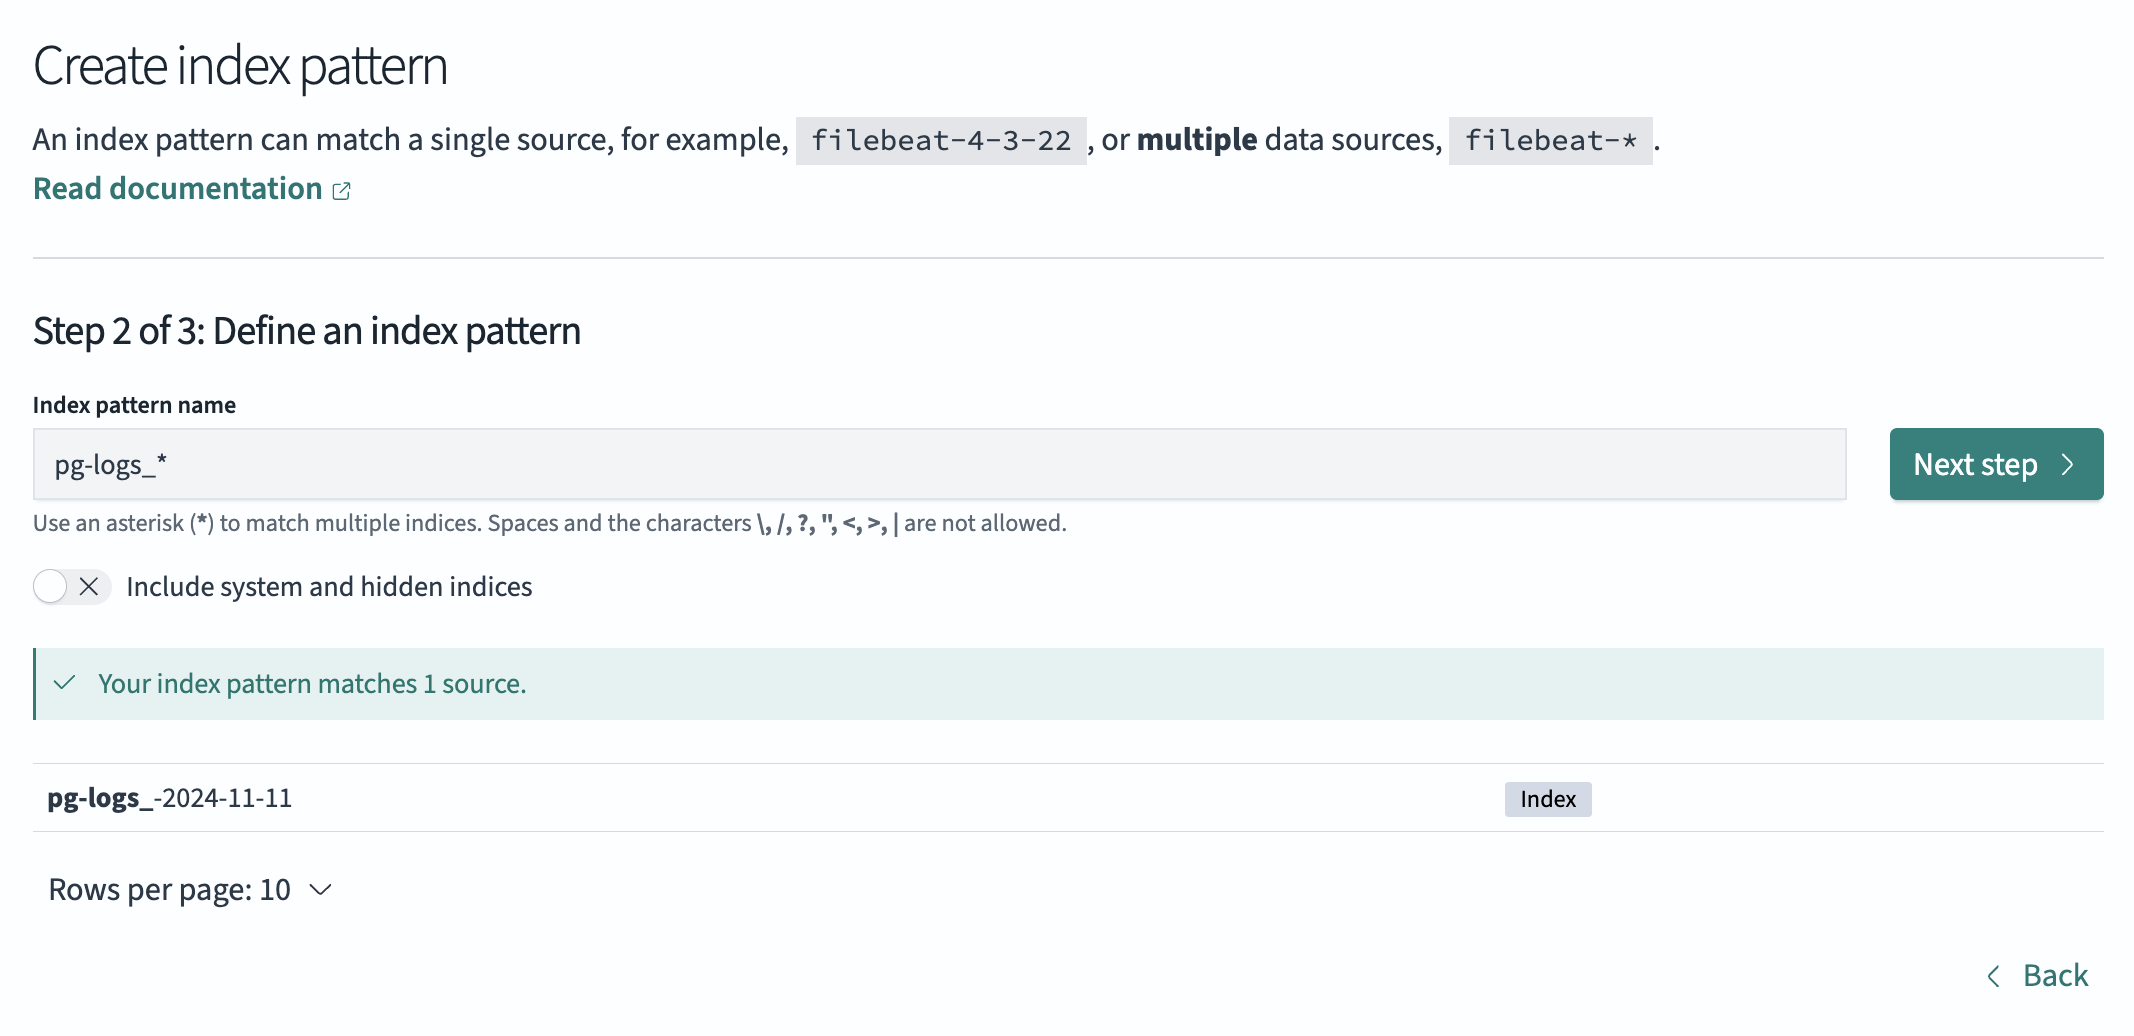
On the final screen of the index pattern creation, select timestamp from the drop-down menu. This will set the primary time field for the index pattern.
When you're done, click Create index pattern.
Viewing and searching logs
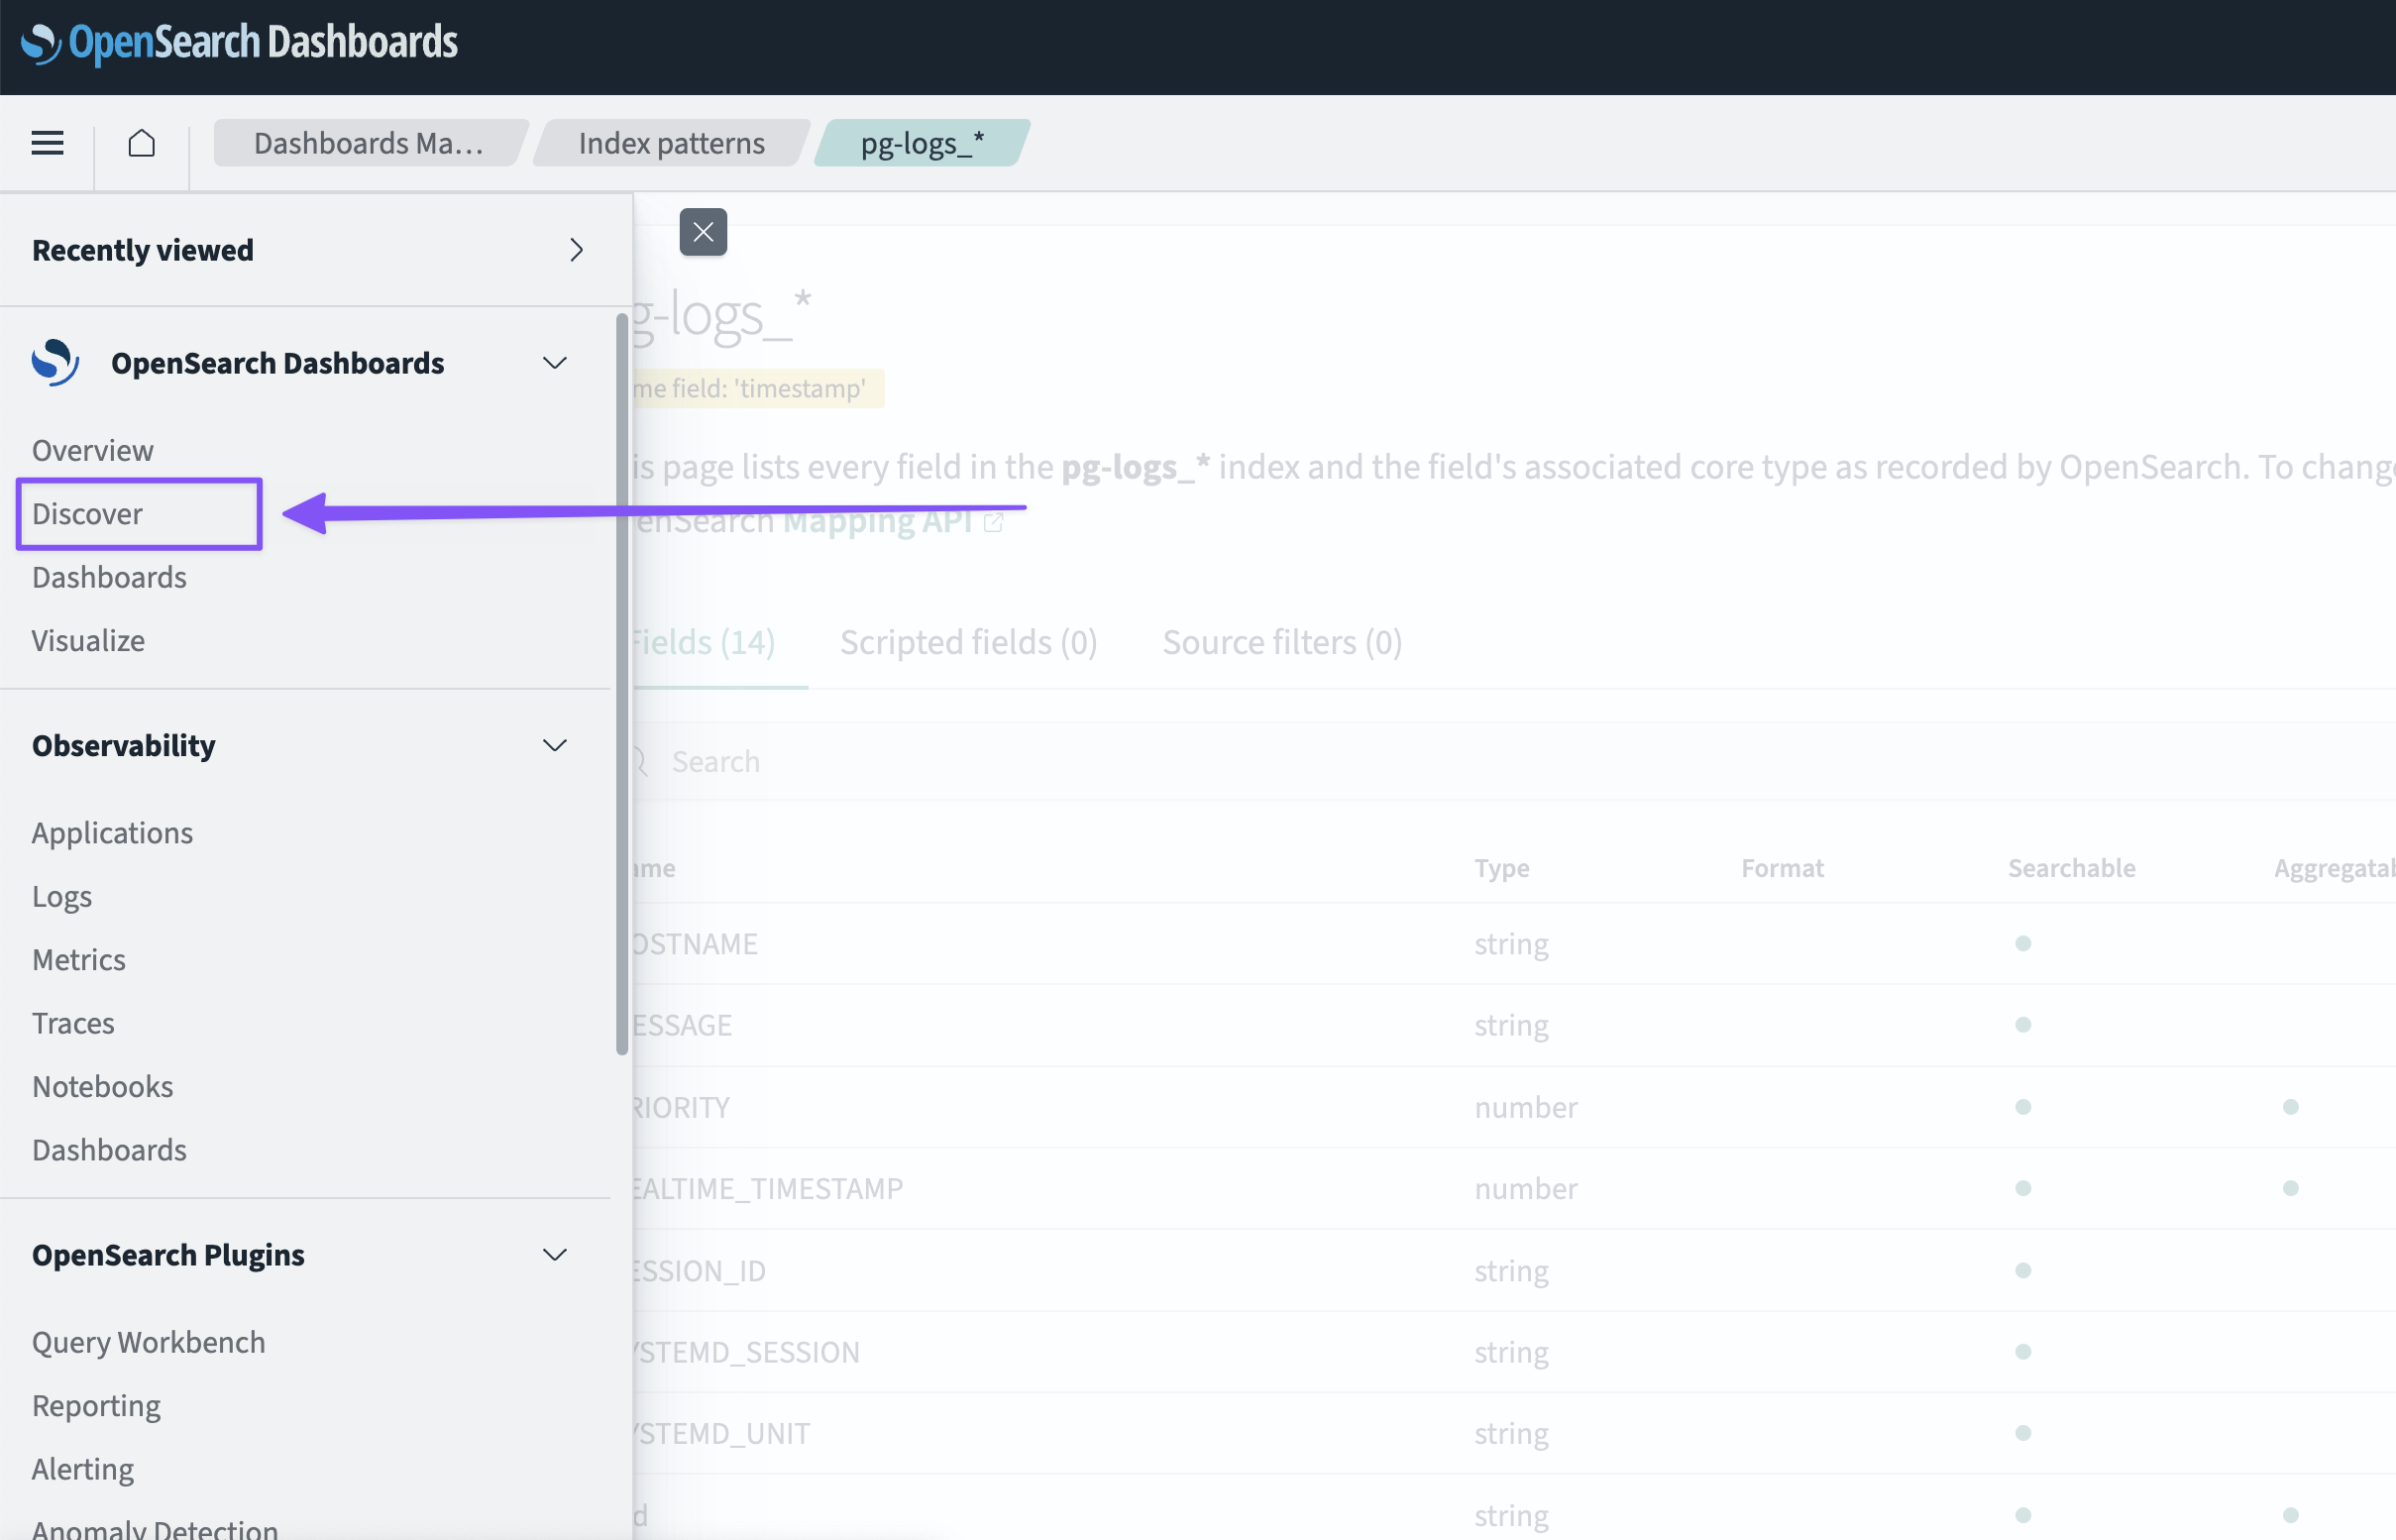
With the index pattern created, click the burger icon to open the menu, and select Discover.
On the Discover page, select your index pattern from the drop-down menu if it isn't already chosen. This will display the log entries from your Managed Database.
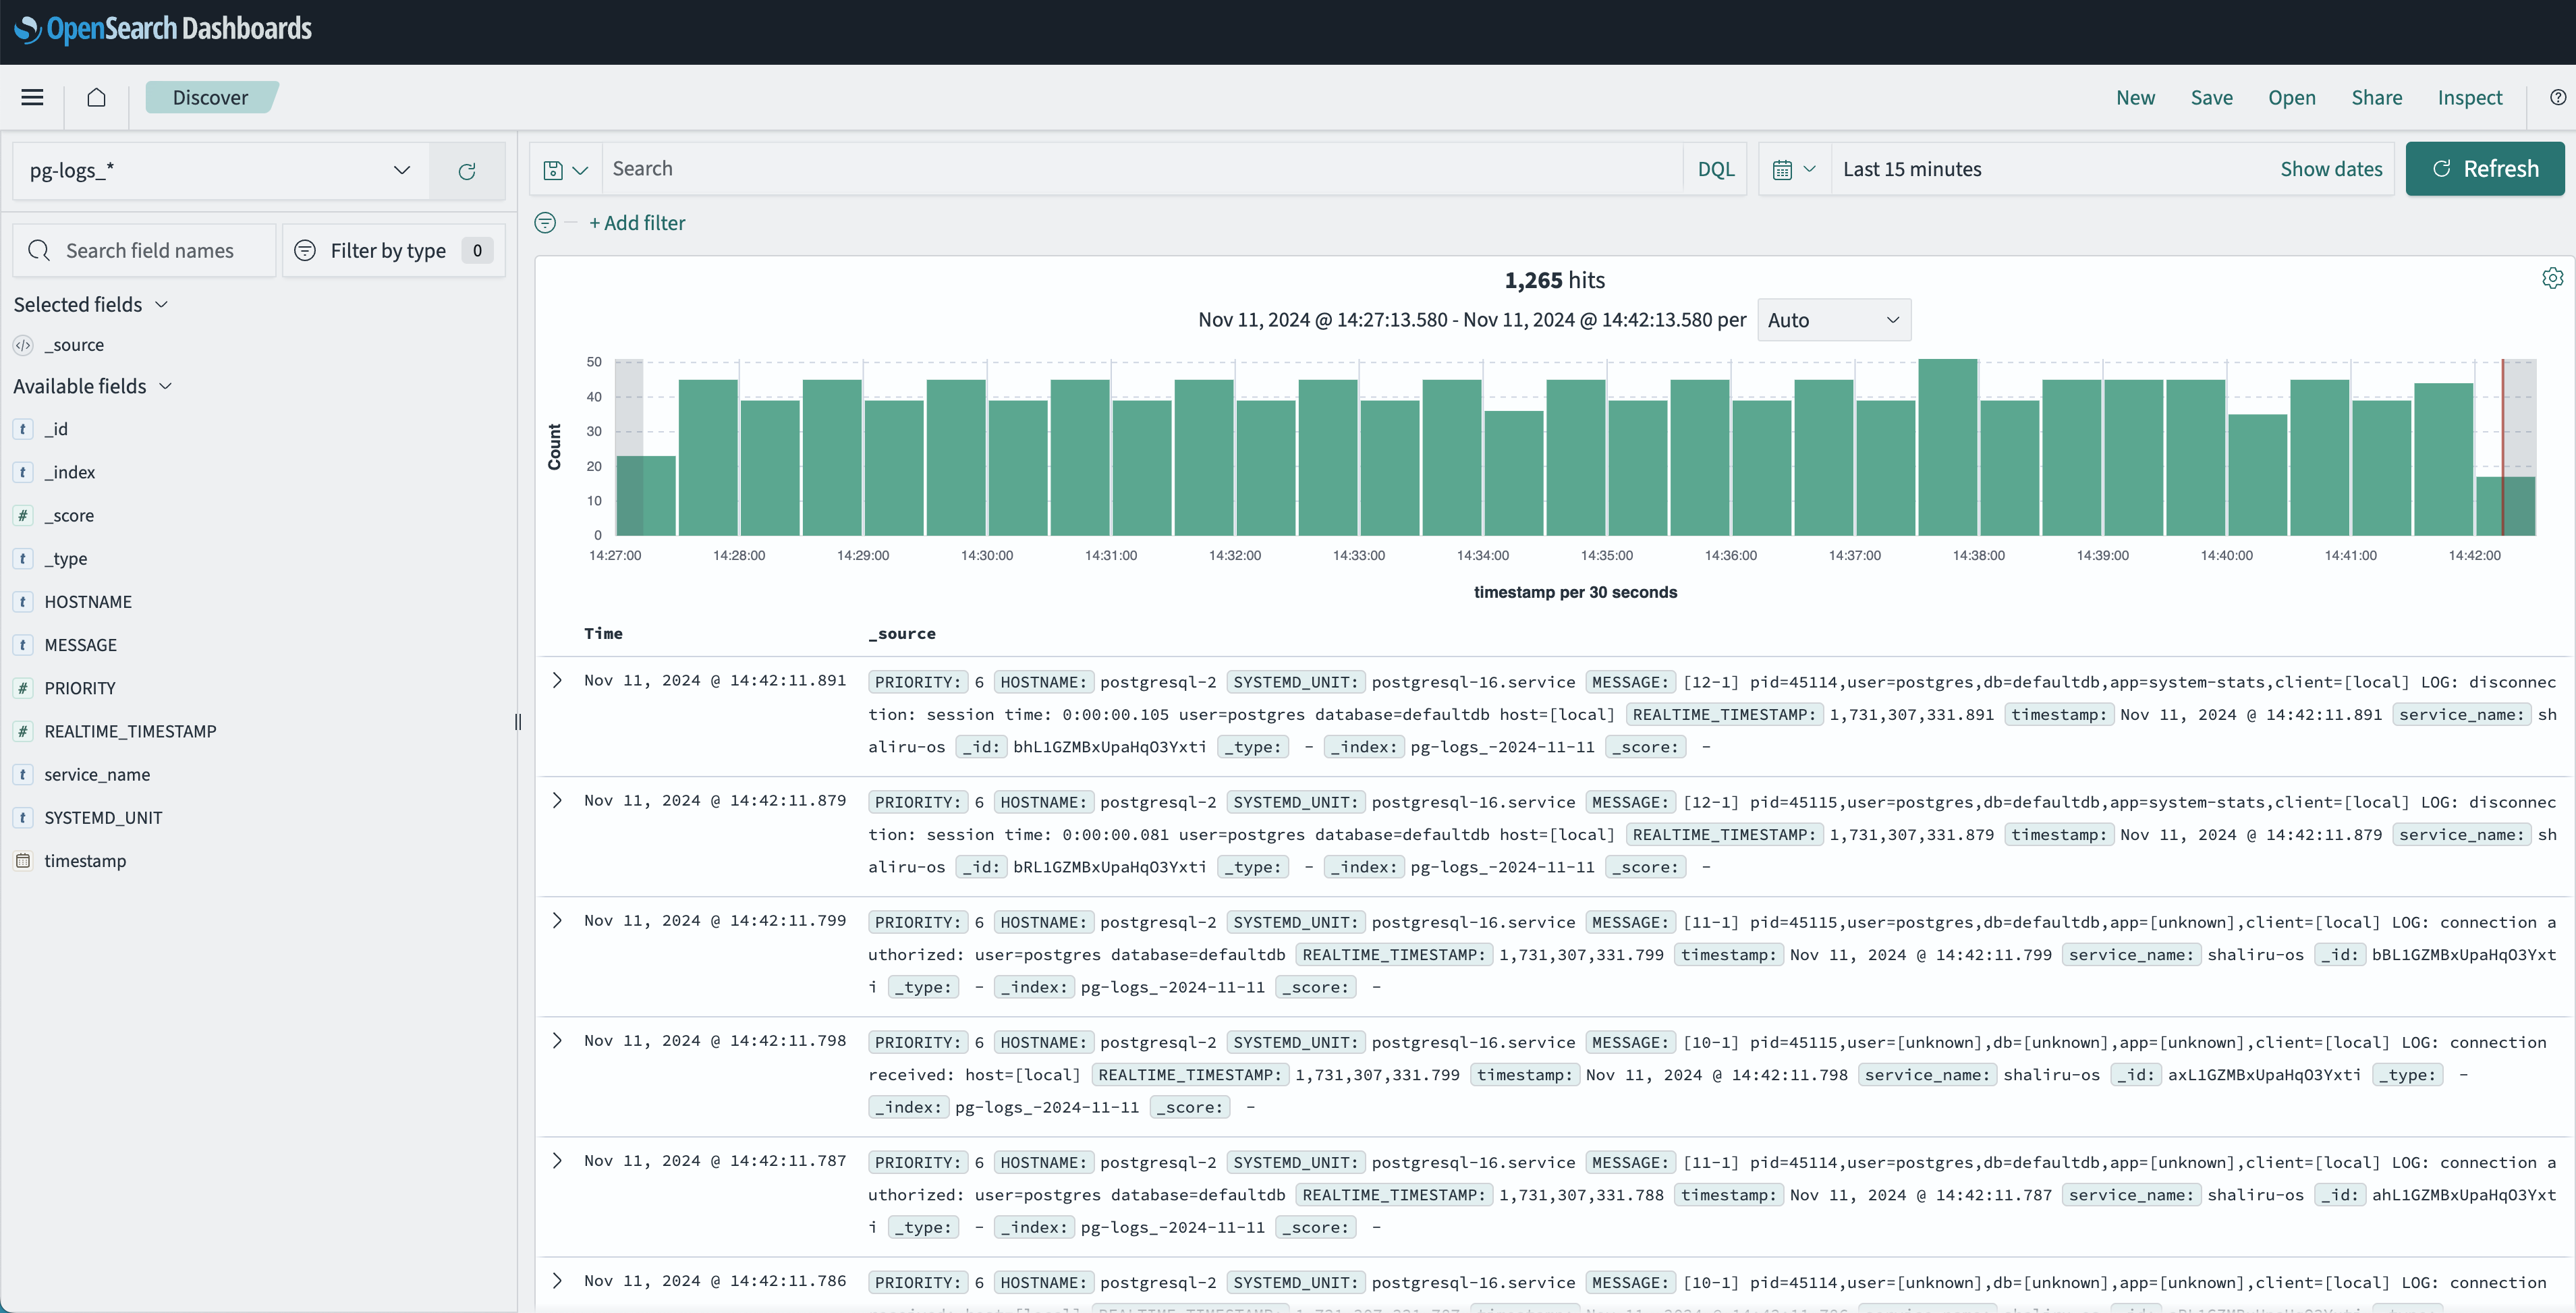
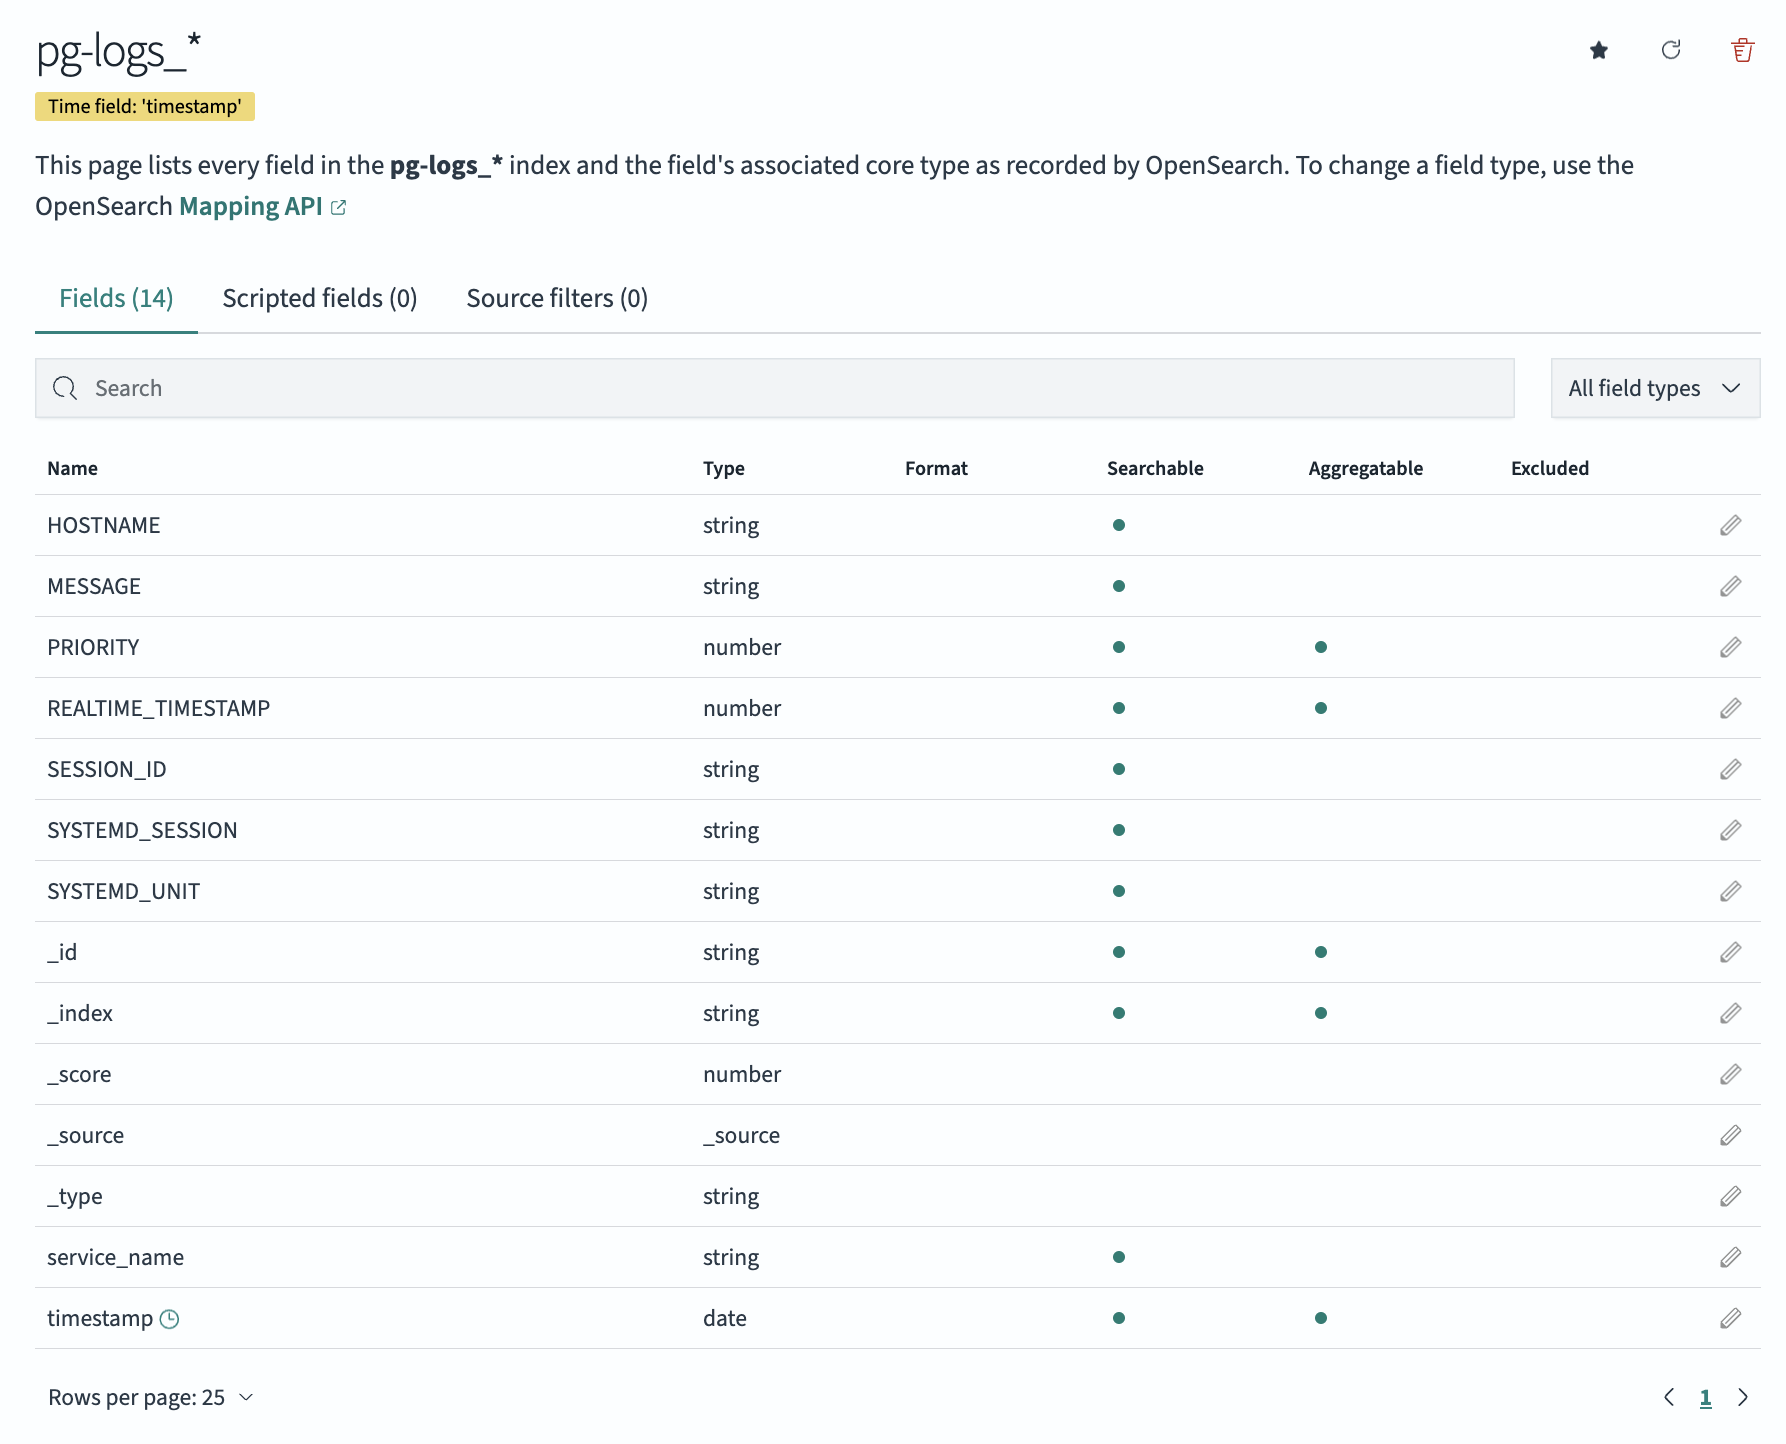
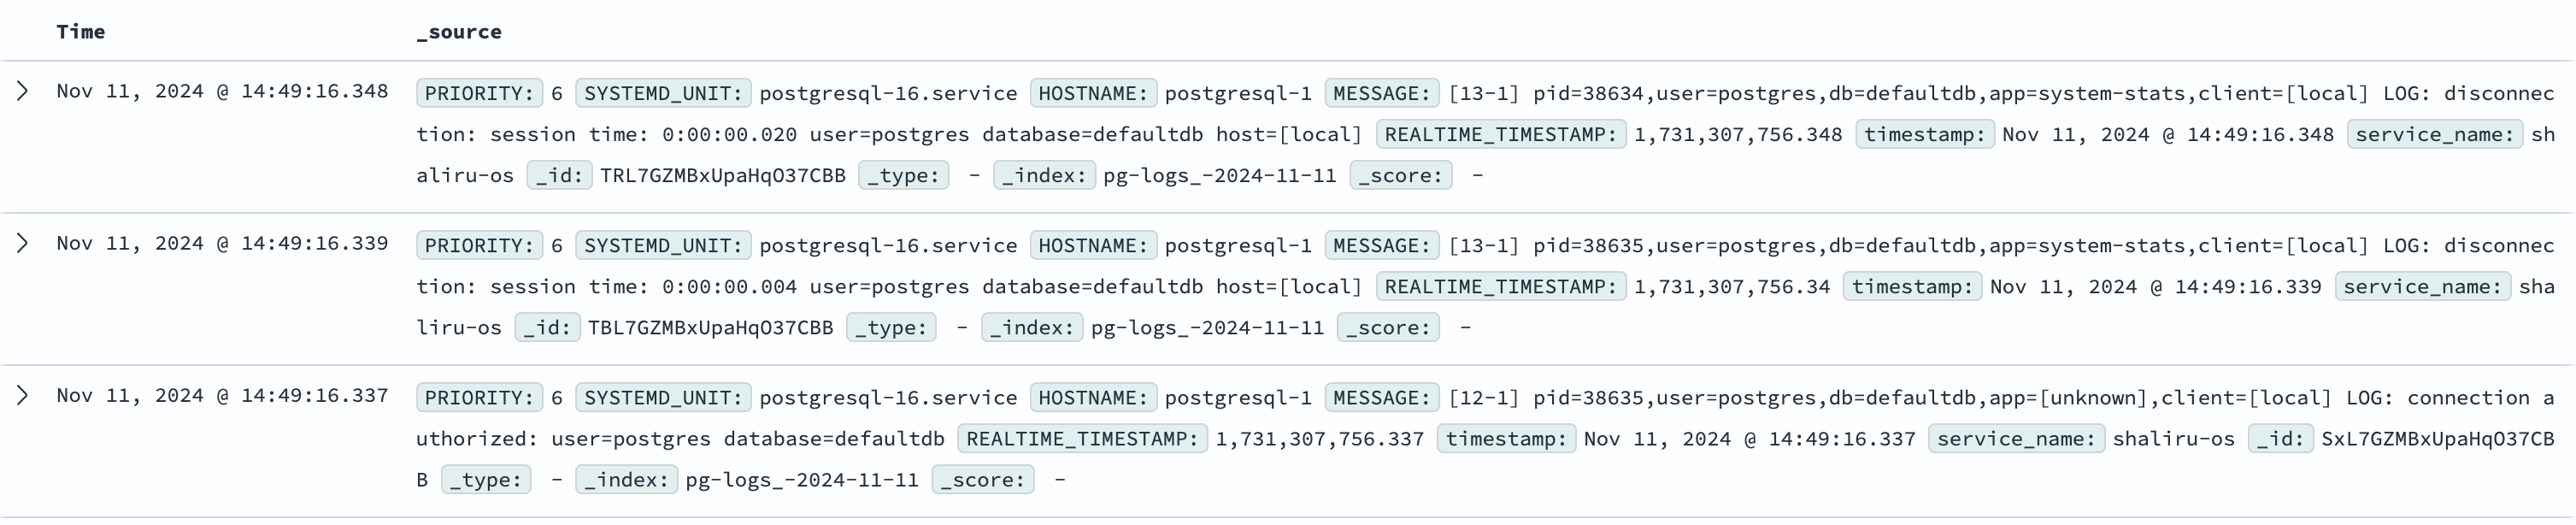
By default, the _source field is selected, which shows all available information for each record, including the PRIORITY, SYSTEMD_UNIT, HOSTNAME, MESSAGE, and more.
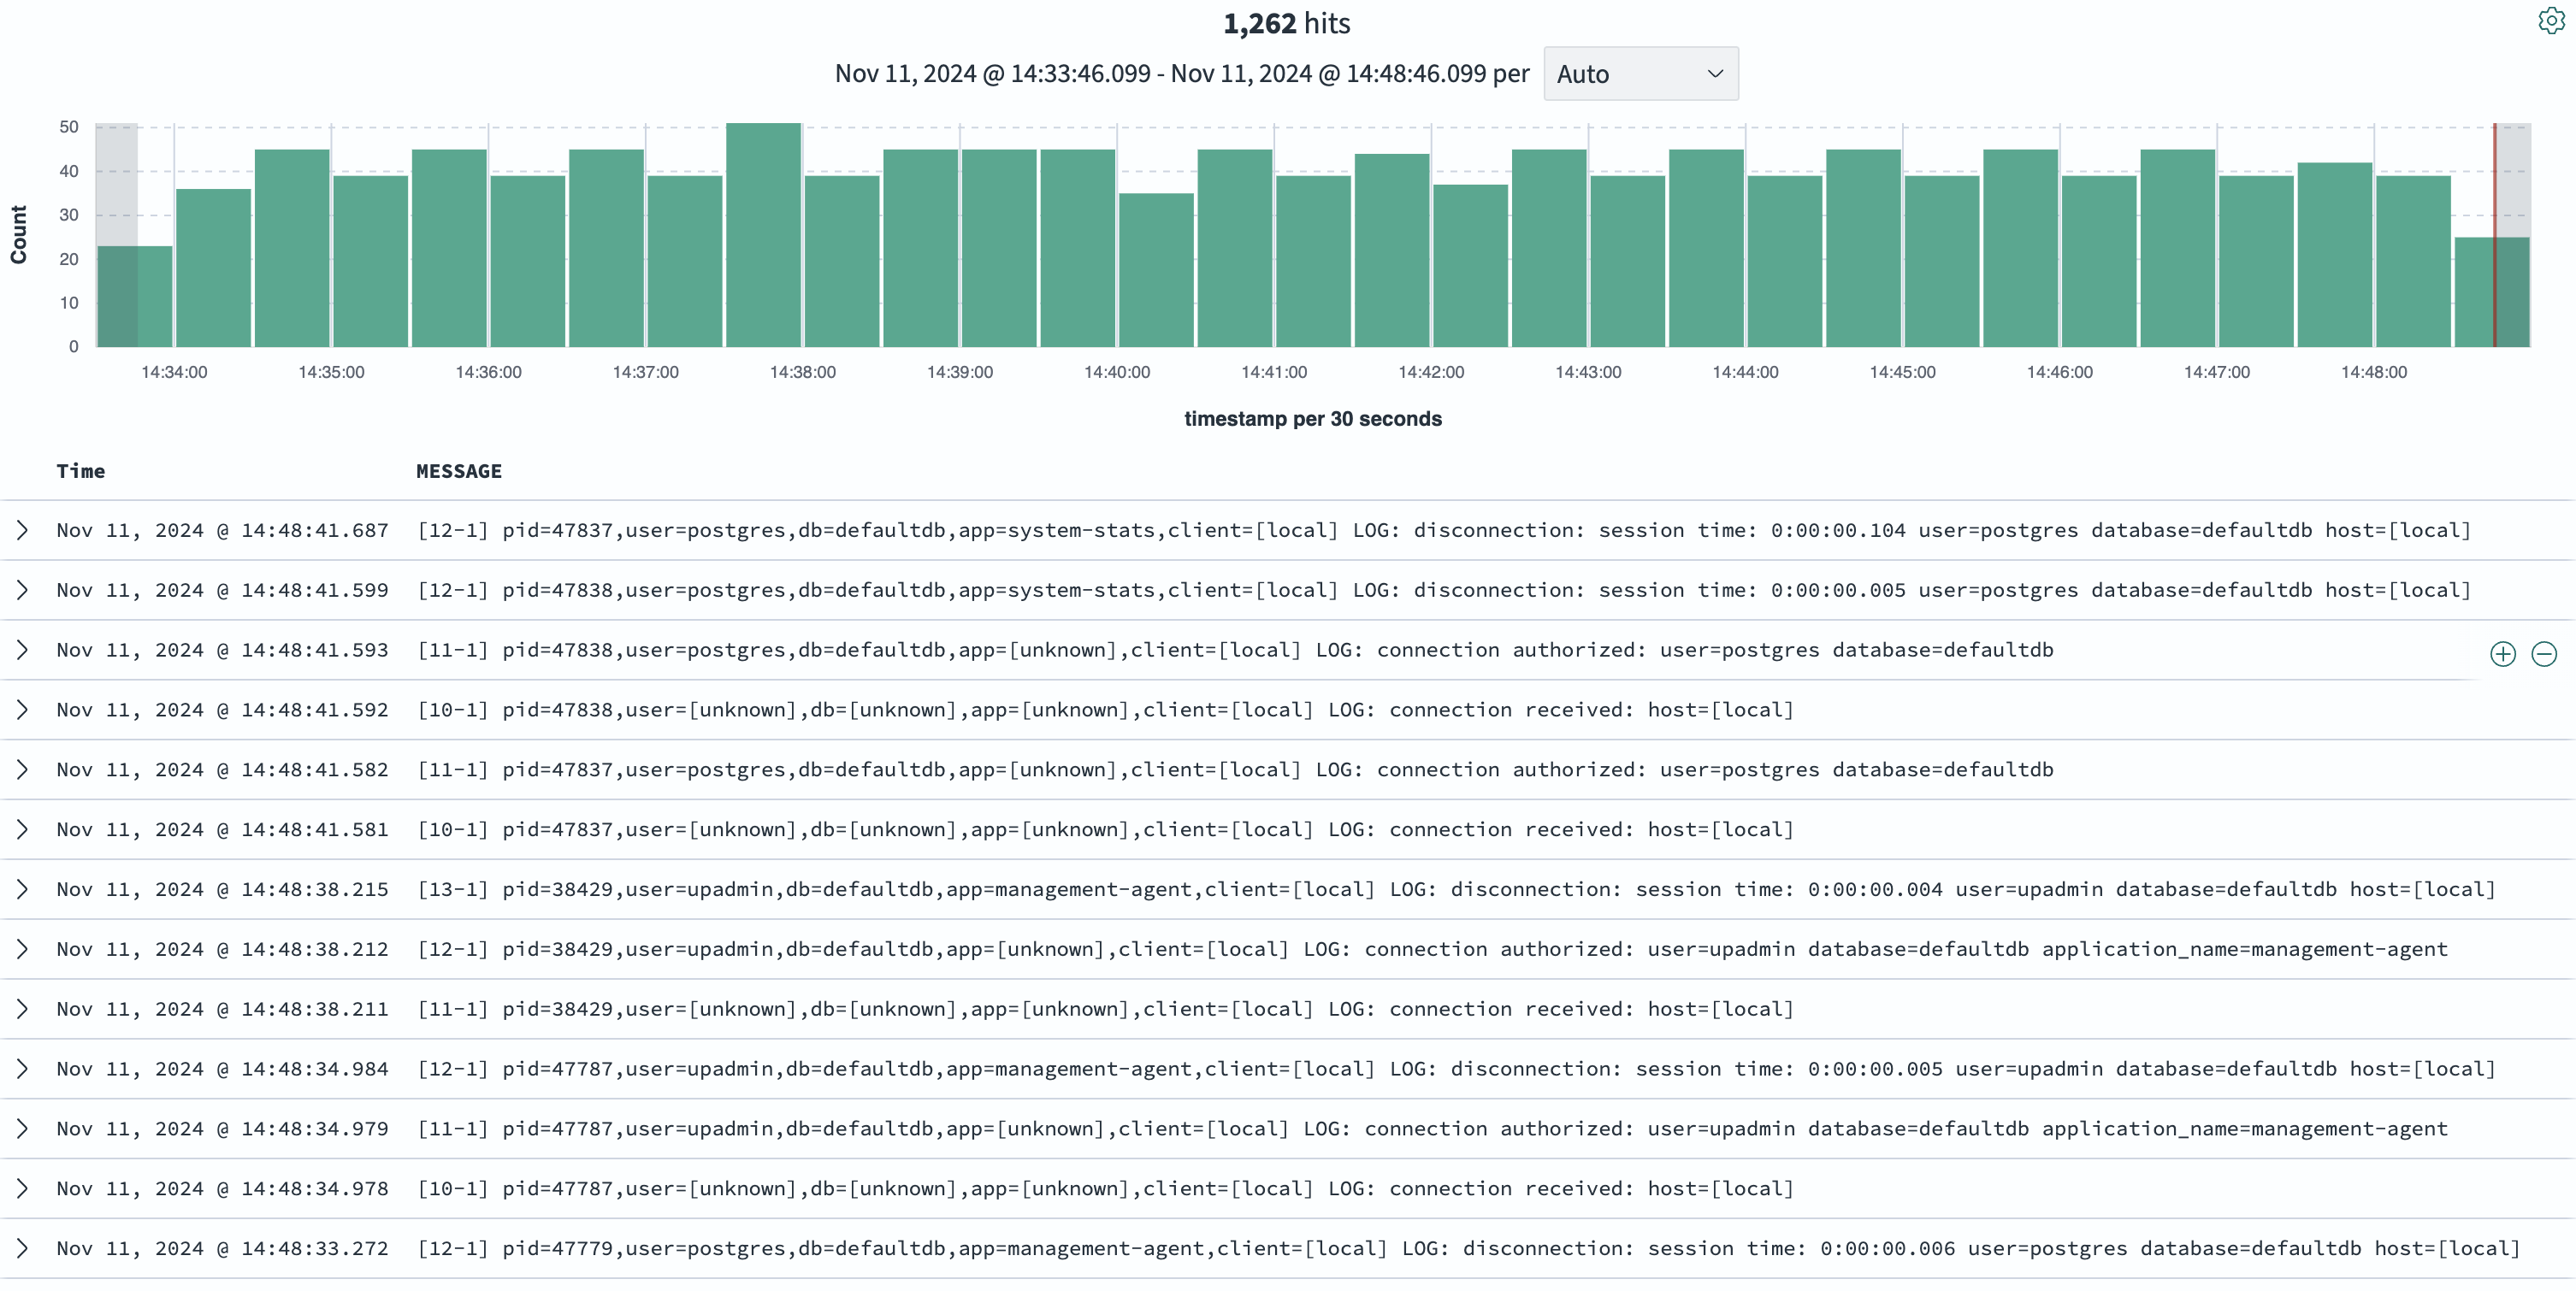
However, you can customise the view by setting specific fields as columns to display only the required data. For example, to view just the actual log message, you can set the MESSAGE field as a column: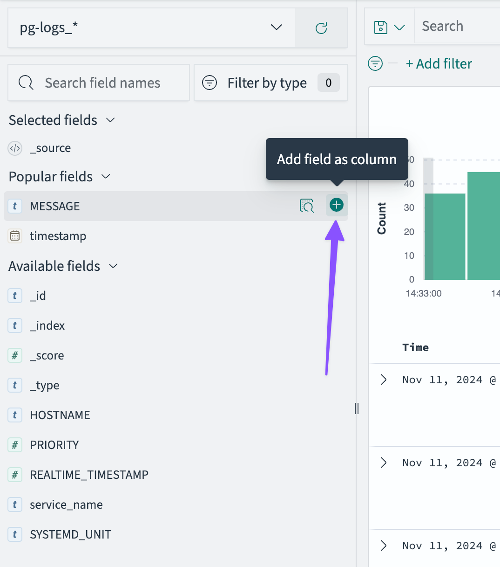
To find specific log entries, you can use the search bar located at the top of the page. You can type in keywords or phrases to quickly locate the information you need. For more advanced searches, OpenSearch Dashboards Query Language (DQL) lets you create complex queries using boolean operators, wildcards, and more.
You can also specify the time range for your search using the time picker in the top right corner. This lets you narrow your search to a specific period, such as the last 15 minutes, last hour, or a custom time range.
OpenSearch Dashboards does more than help you search through logs. It provides tools that show your data in clear, visual ways. You can create charts and graphs that update automatically, helping you spot patterns and track important numbers. You can also build custom displays that put all your key information in one place. These displays can be adjusted to show exactly what matters to you and your team.
To explore these features, refer to the OpenSearch Dashboards documentation.
Rsyslog
Rsyslog is a reliable and secure logging system that lets you collect log messages from various sources, centralising them into a single location for easier monitoring and analysis.
Installing Rsyslog
If you don't already have rsyslog installed, you can do so using the command below:
# Ubuntu/Debian-based server
sudo apt update
sudo apt install rsyslog

# CentOS/RHEL 8 and newer
sudo dnf install rsyslog

# CentOS/RHEL 7 and older
sudo yum install rsyslog
Creating the integration for Rsyslog
Before you begin, ensure rsyslog is already running on a server that can receive logs, as this is required for the integration.
Important: If you have a firewall in place (like the UpCloud firewall, iptables, ufw, or firewalld), you must configure it to allow incoming traffic on the syslog port (usually port 514). Without this, the syslog messages will be blocked and won't reach your server.
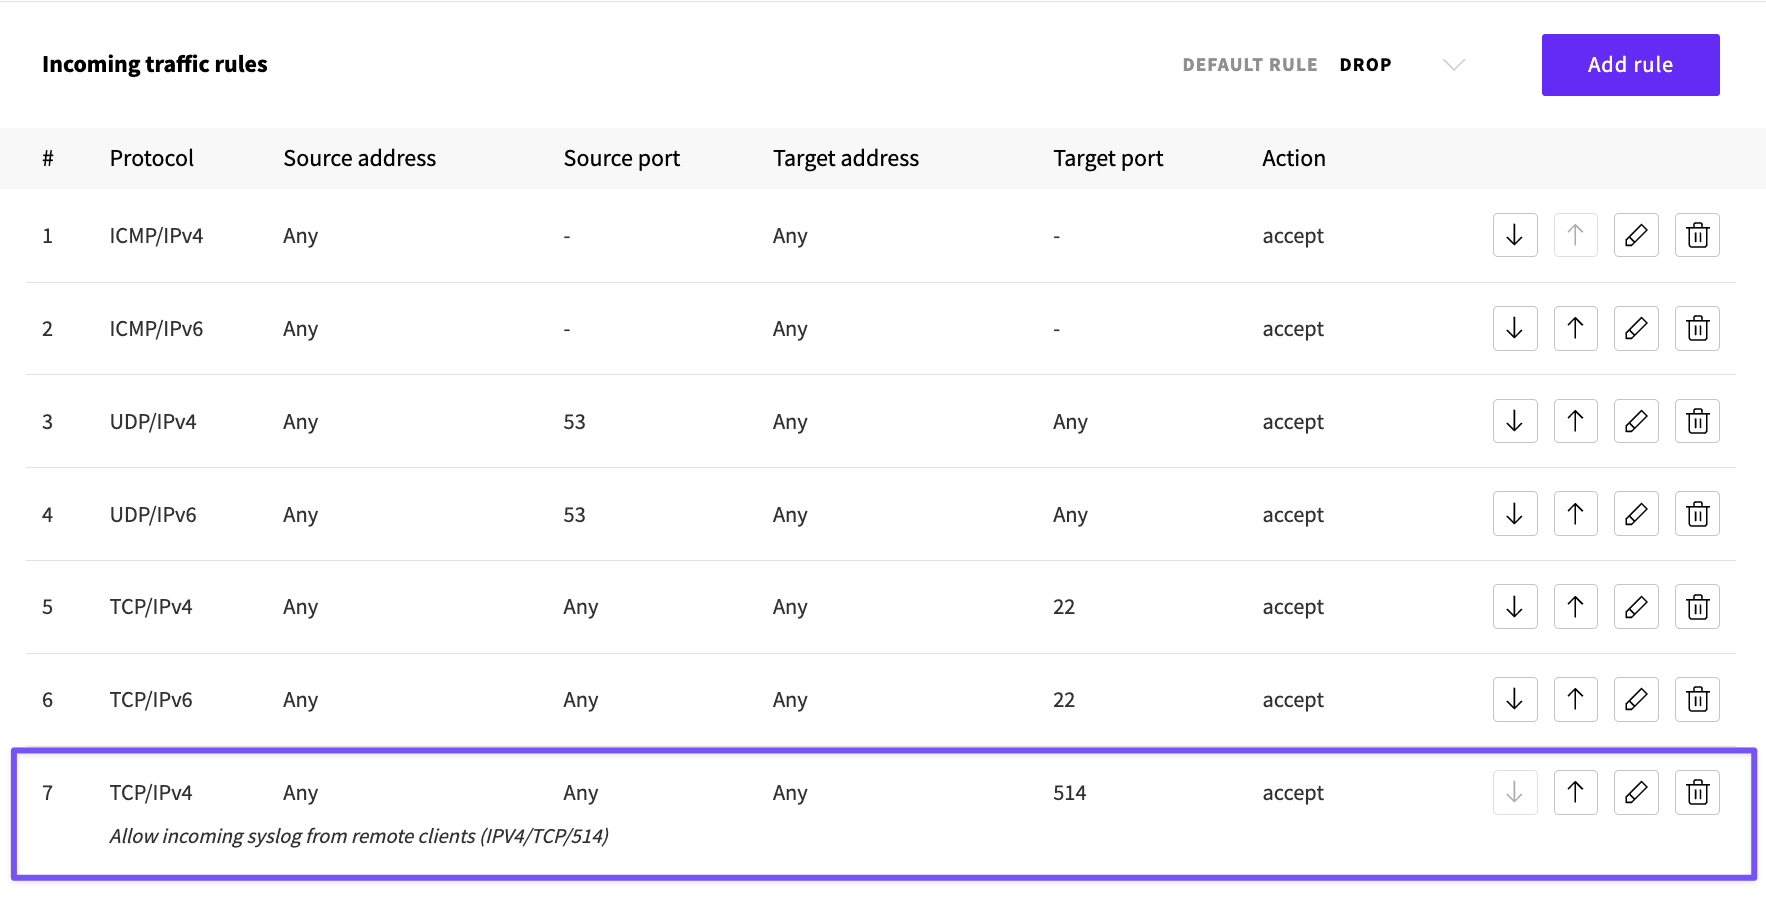
# For UFW
sudo ufw allow 514/tcp

# For firewalld (CentOS/RHEL)
sudo firewall-cmd --permanent --add-port=514/tcp && sudo firewall-cmd --reload

# For iptables
sudo iptables -A INPUT -p tcp --dport 514 -j ACCEPT
Start by opening the Managed Database from which you wish to export the logs - this can be any Managed Database. Then, under the Logs tab, click the Create database integration button to get started.
- Select Rsyslog as the integration type.
- Choose a name for the integration. This can be anything that will help you identify the integration in the future.
- Enter the IP address and port number of your existing rsyslog server.
- Specify a max message size (in bytes) or use the default values.
- Select a format that the log entries will be exported in. For most use cases, it is recommended to use RFC5424 as it provides a standardised and structured format. However if you have a specific requirement, you can choose RFC3164 or a custom format instead.
- Enable TLS encryption to encrypt the log data in transit (optional but recommended). See Establishing a TLS connection for instructions.
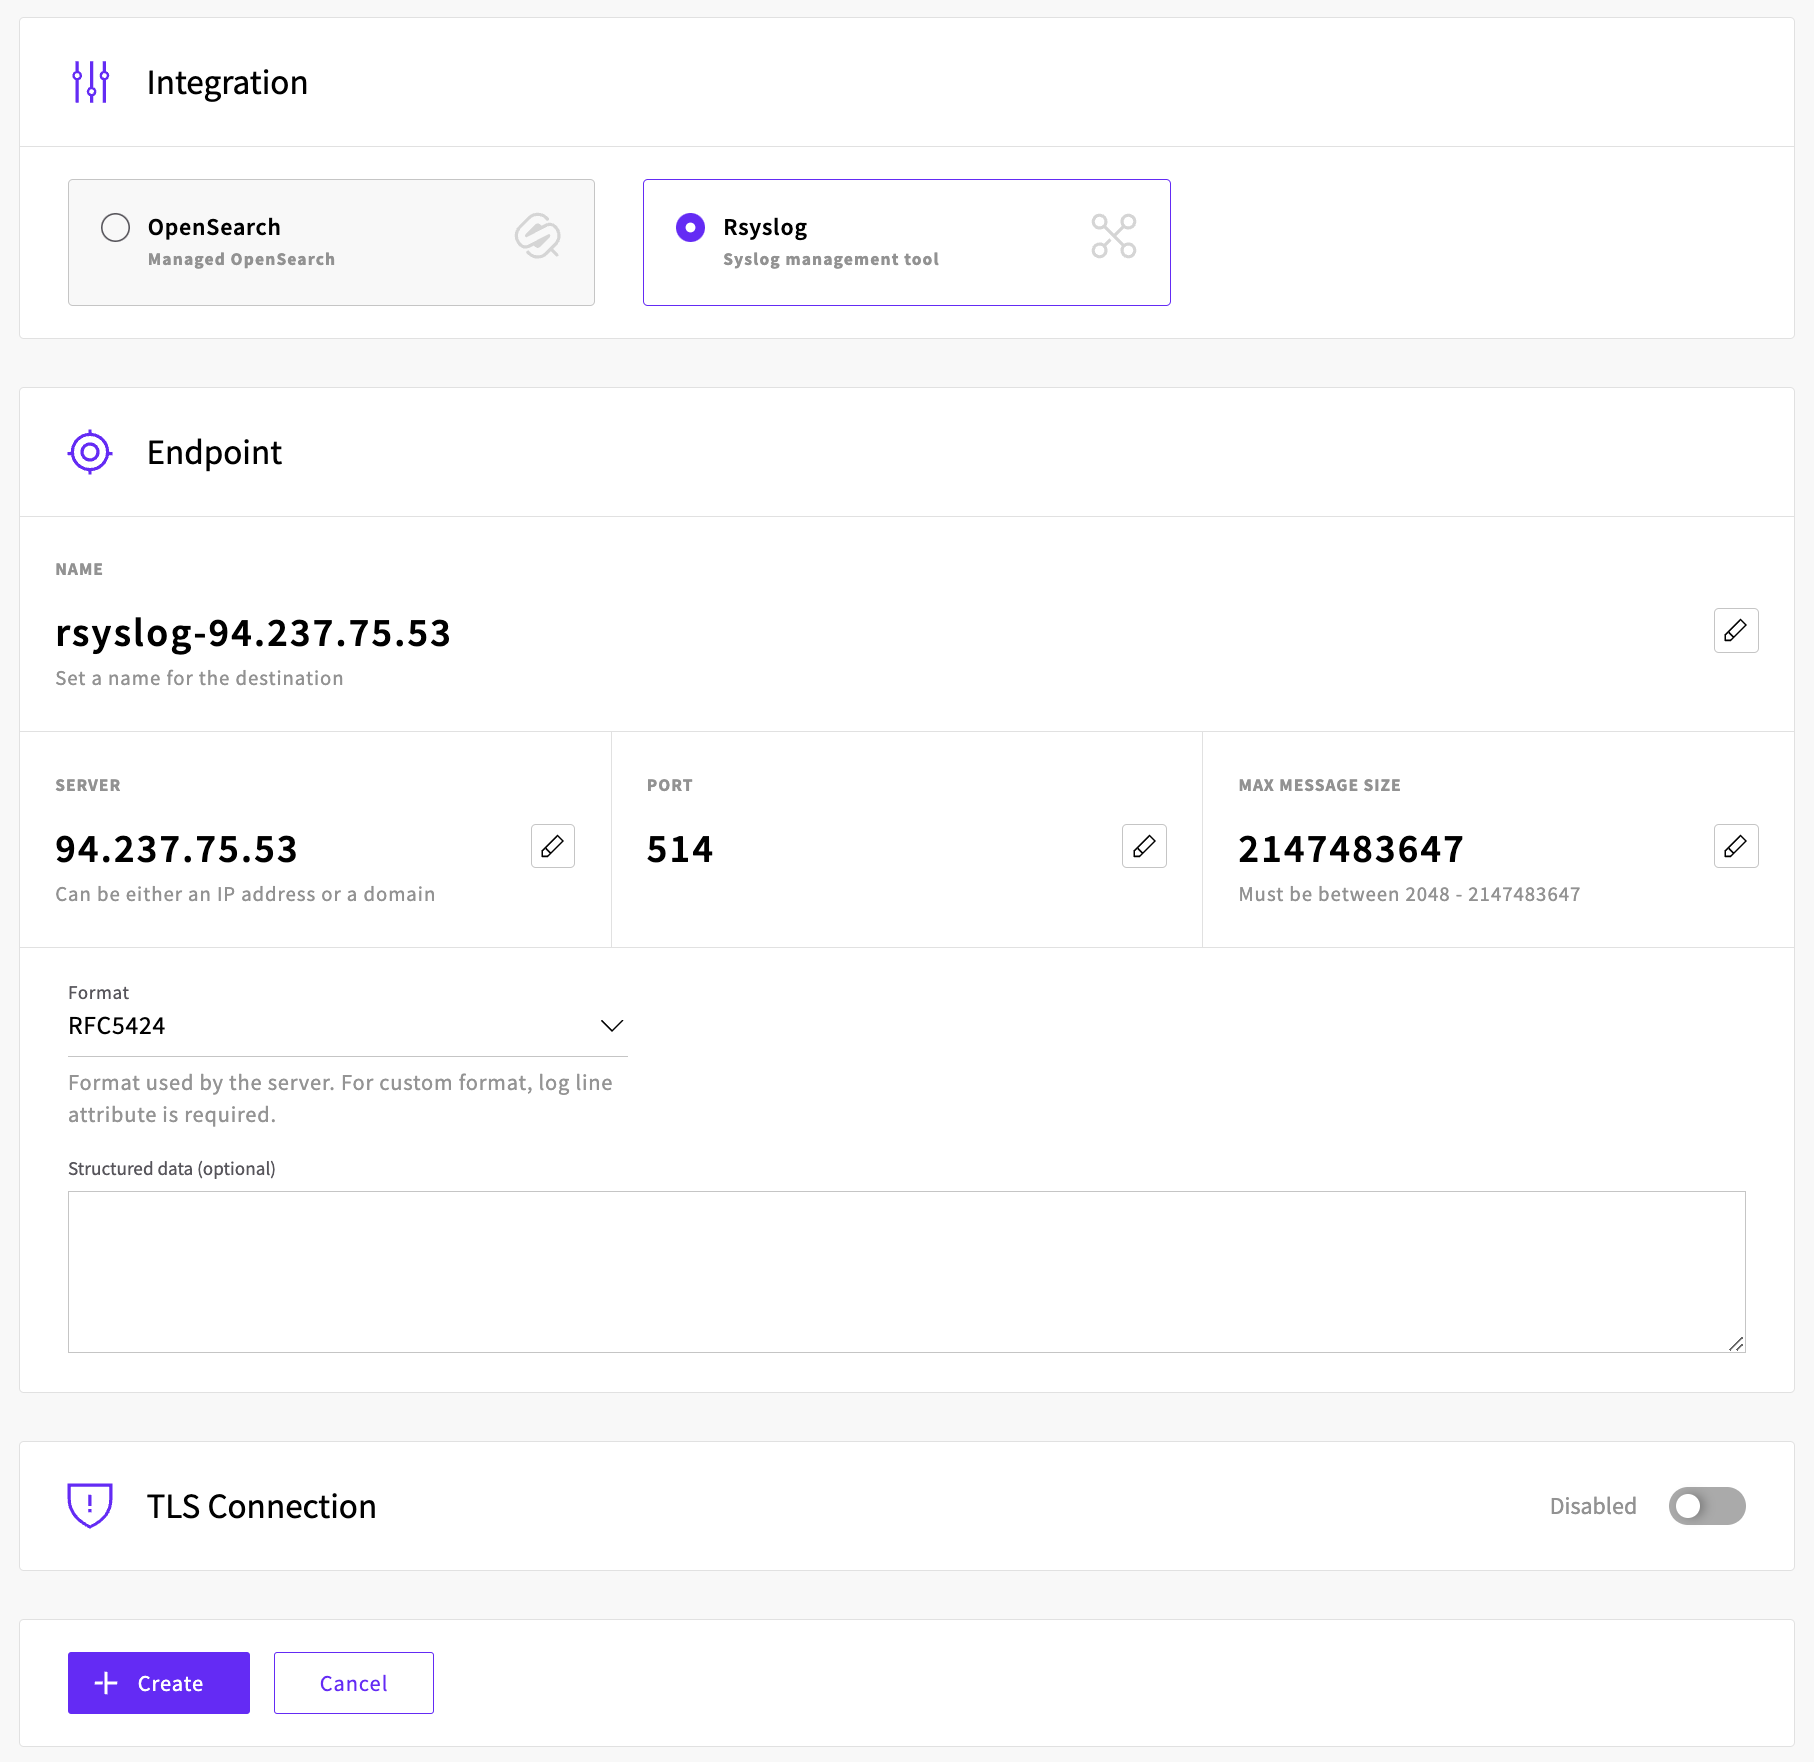
- Click create to to set up the integration.
Configuring your rsyslog server
If your Rsyslog server is correctly set up, it should automatically receive the logs from your Managed Database. By default, the logs are saved in /var/log/syslog (or /var/log/messages in CentOS), and you can view them in real-time using the command below:
sudo tail -f /var/log/syslog

sudo tail -f /var/log/messages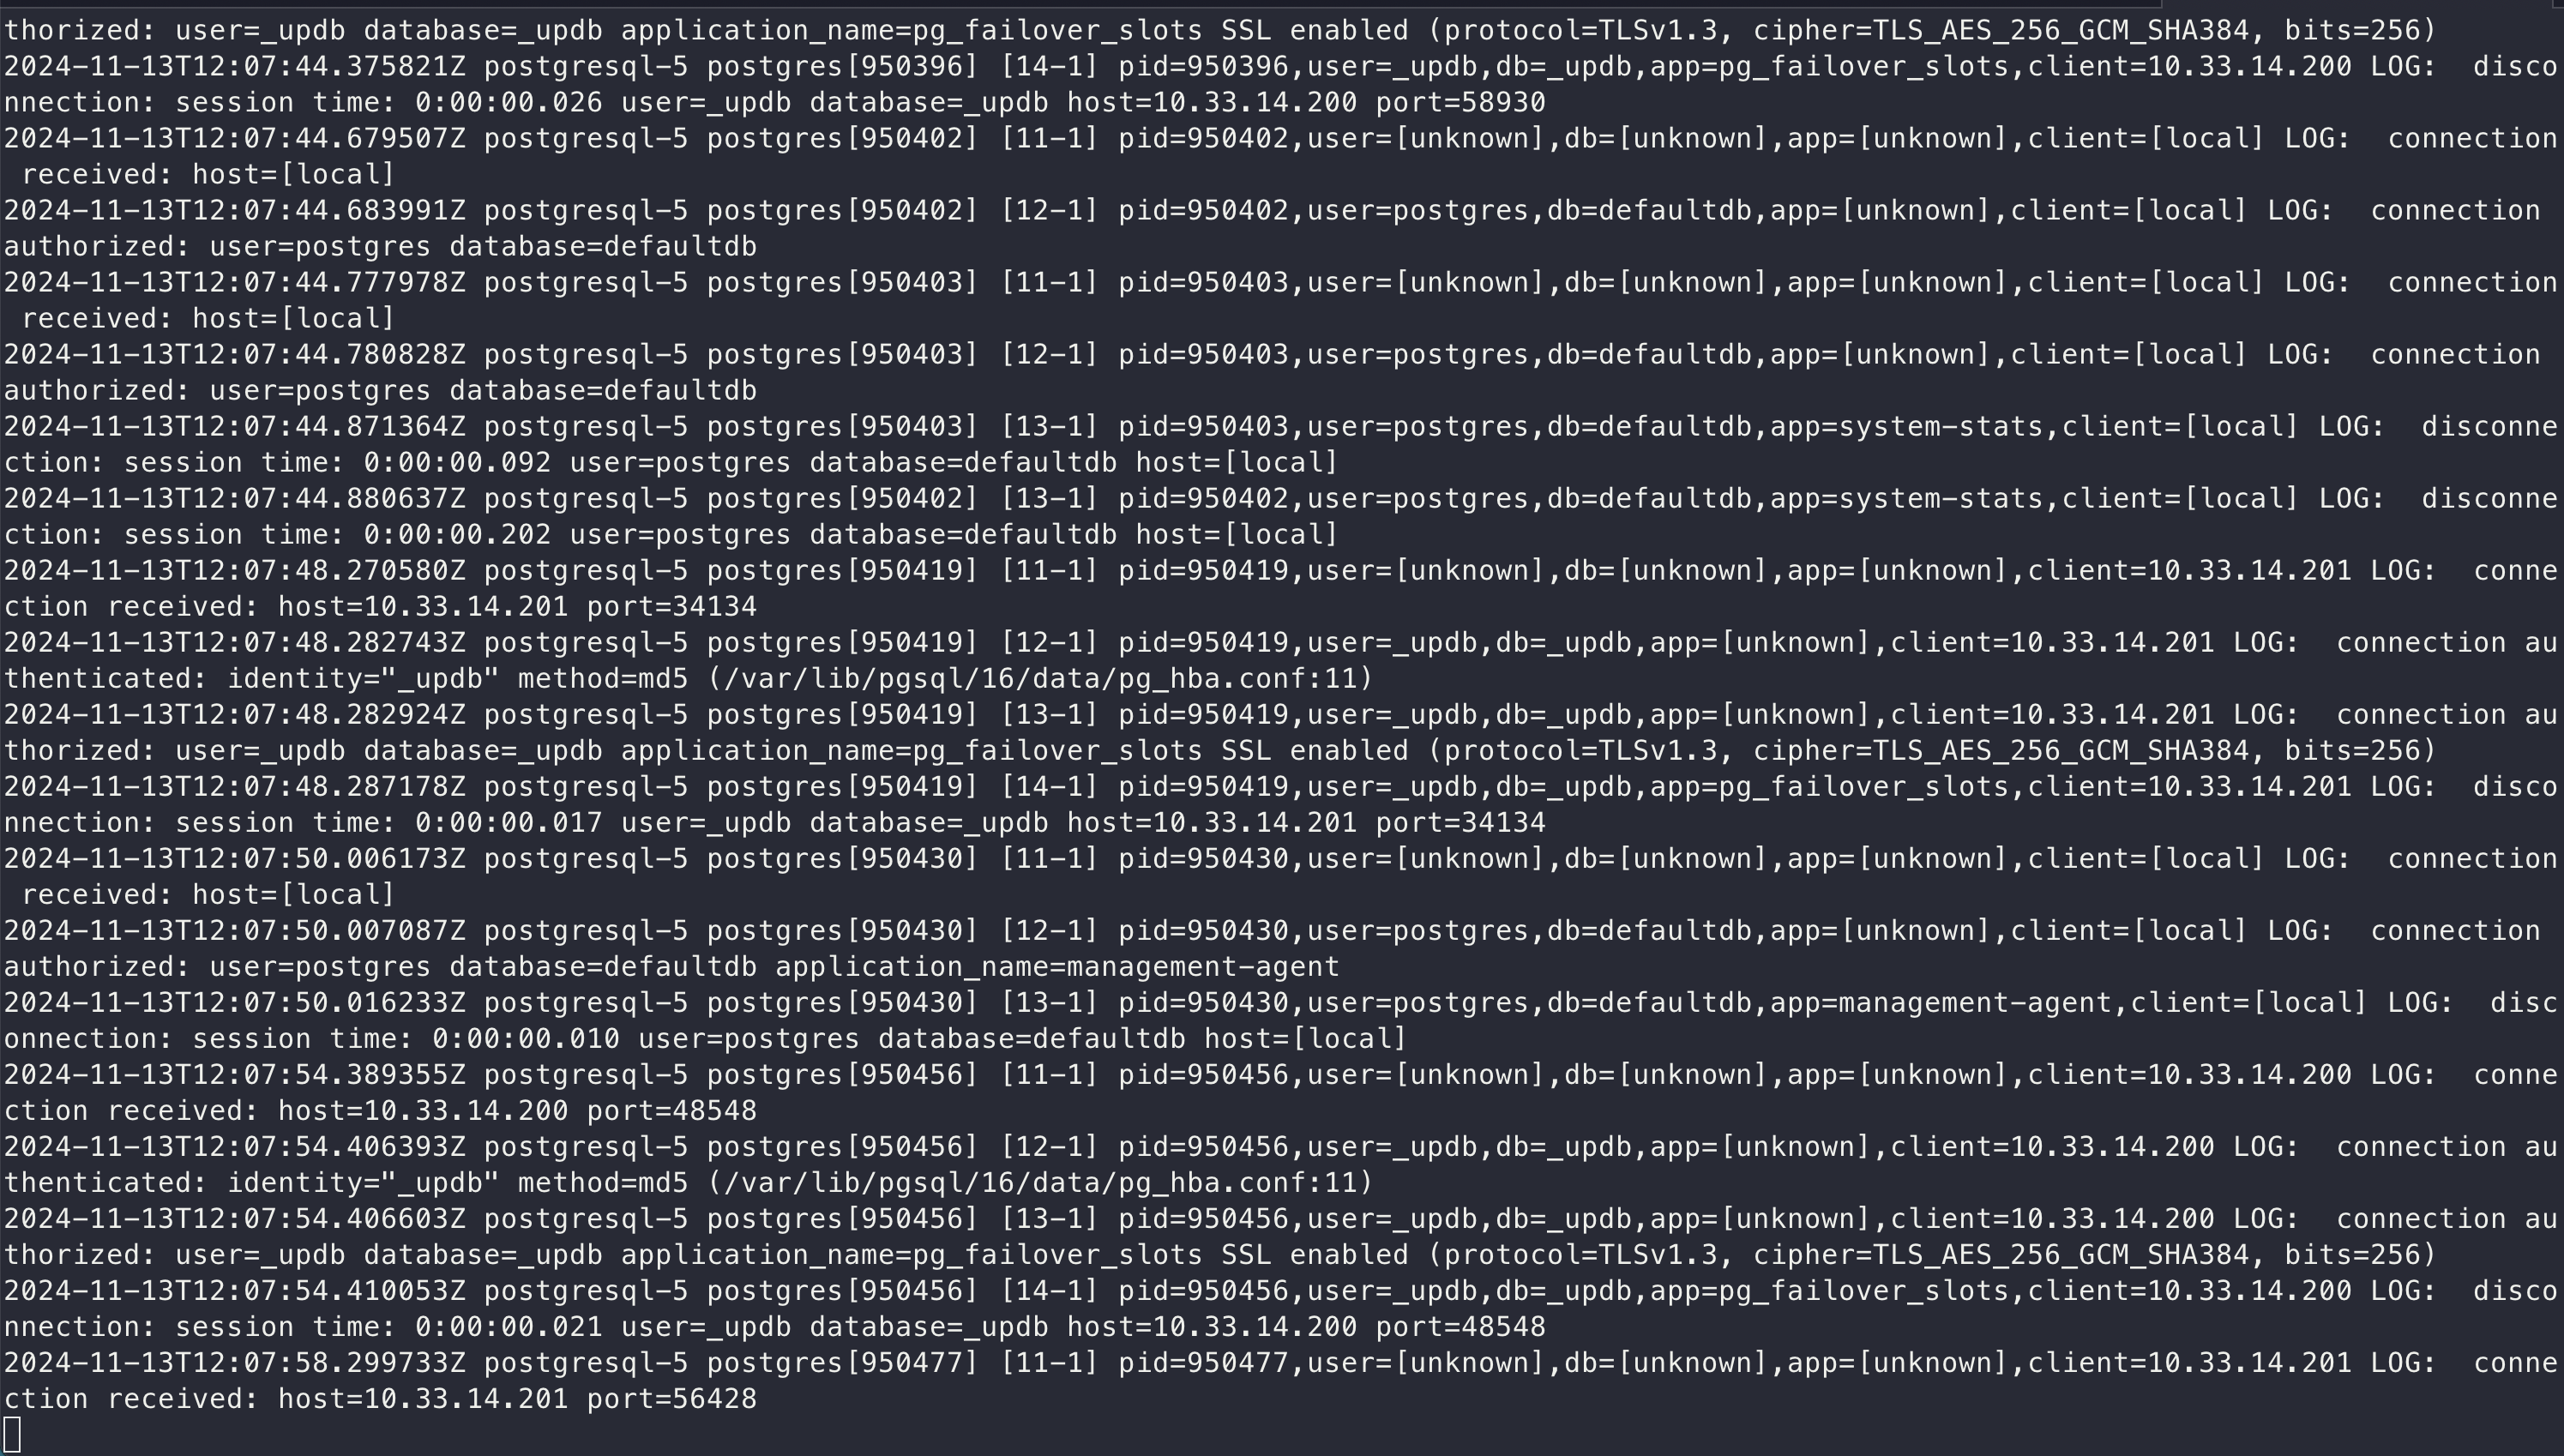
If you don't see any activity in the logs, open your rsyslog configuration file with the following command:
sudo nano /etc/rsyslog.confUnder the modules section make sure the lines relating to TCP syslog reception are uncommented and the port number matches what you specified in the UpCloud Control Panel like this:
# provides TCP syslog reception
module(load="imtcp")
input(type="imtcp" port="514")
After updating the file, restart rsyslog and tail the syslog file again.
sudo systemctl restart rsyslog

sudo tail -f /var/log/syslog
or
sudo tail -f /var/log/messages
You should now see log entries from your database in the log file.
Establishing a TLS connection
While rsyslog works well without encryption, enabling TLS is highly recommended for production environments. TLS encryption ensures that your log data remains confidential while in transit between your database and the rsyslog server.
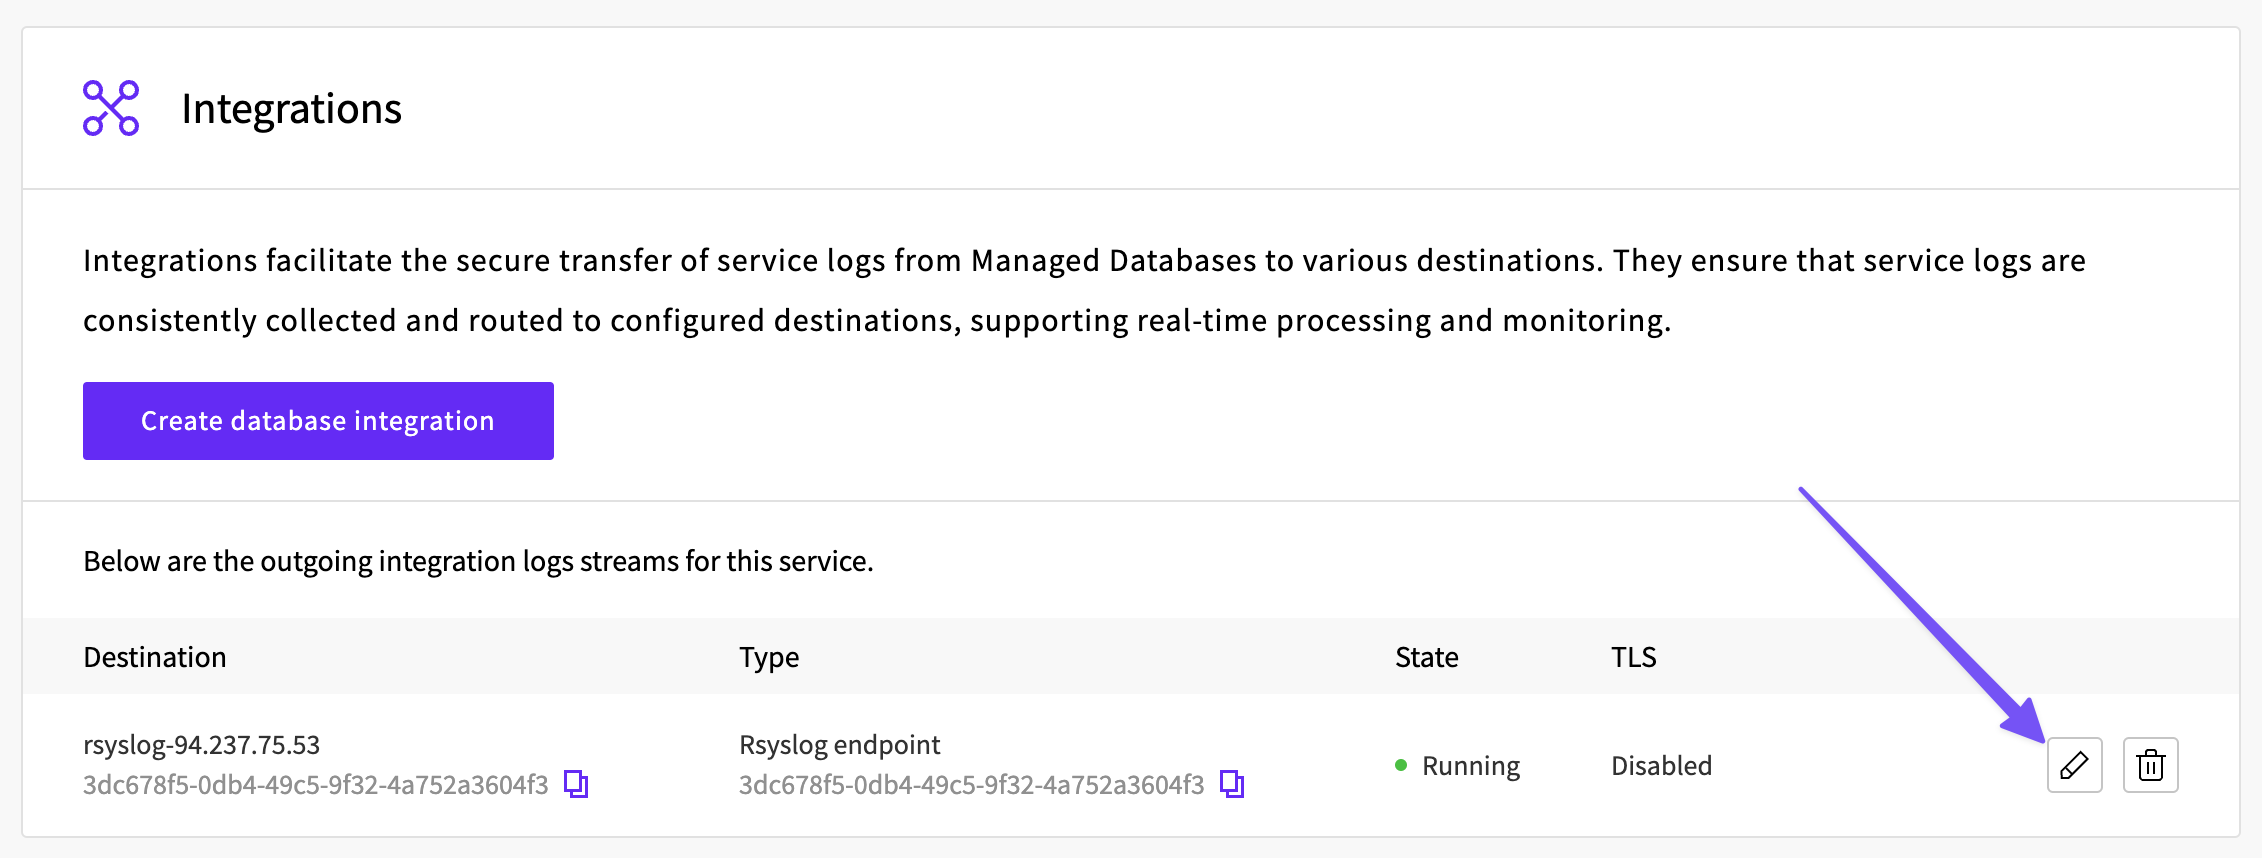
To encrypt your logs in transit, you need to enable TLS connection for the integration. You can do this while setting up a new integration, or if you already have an existing integration with TLD disabled, you can click the pencil icon to open it for editing.
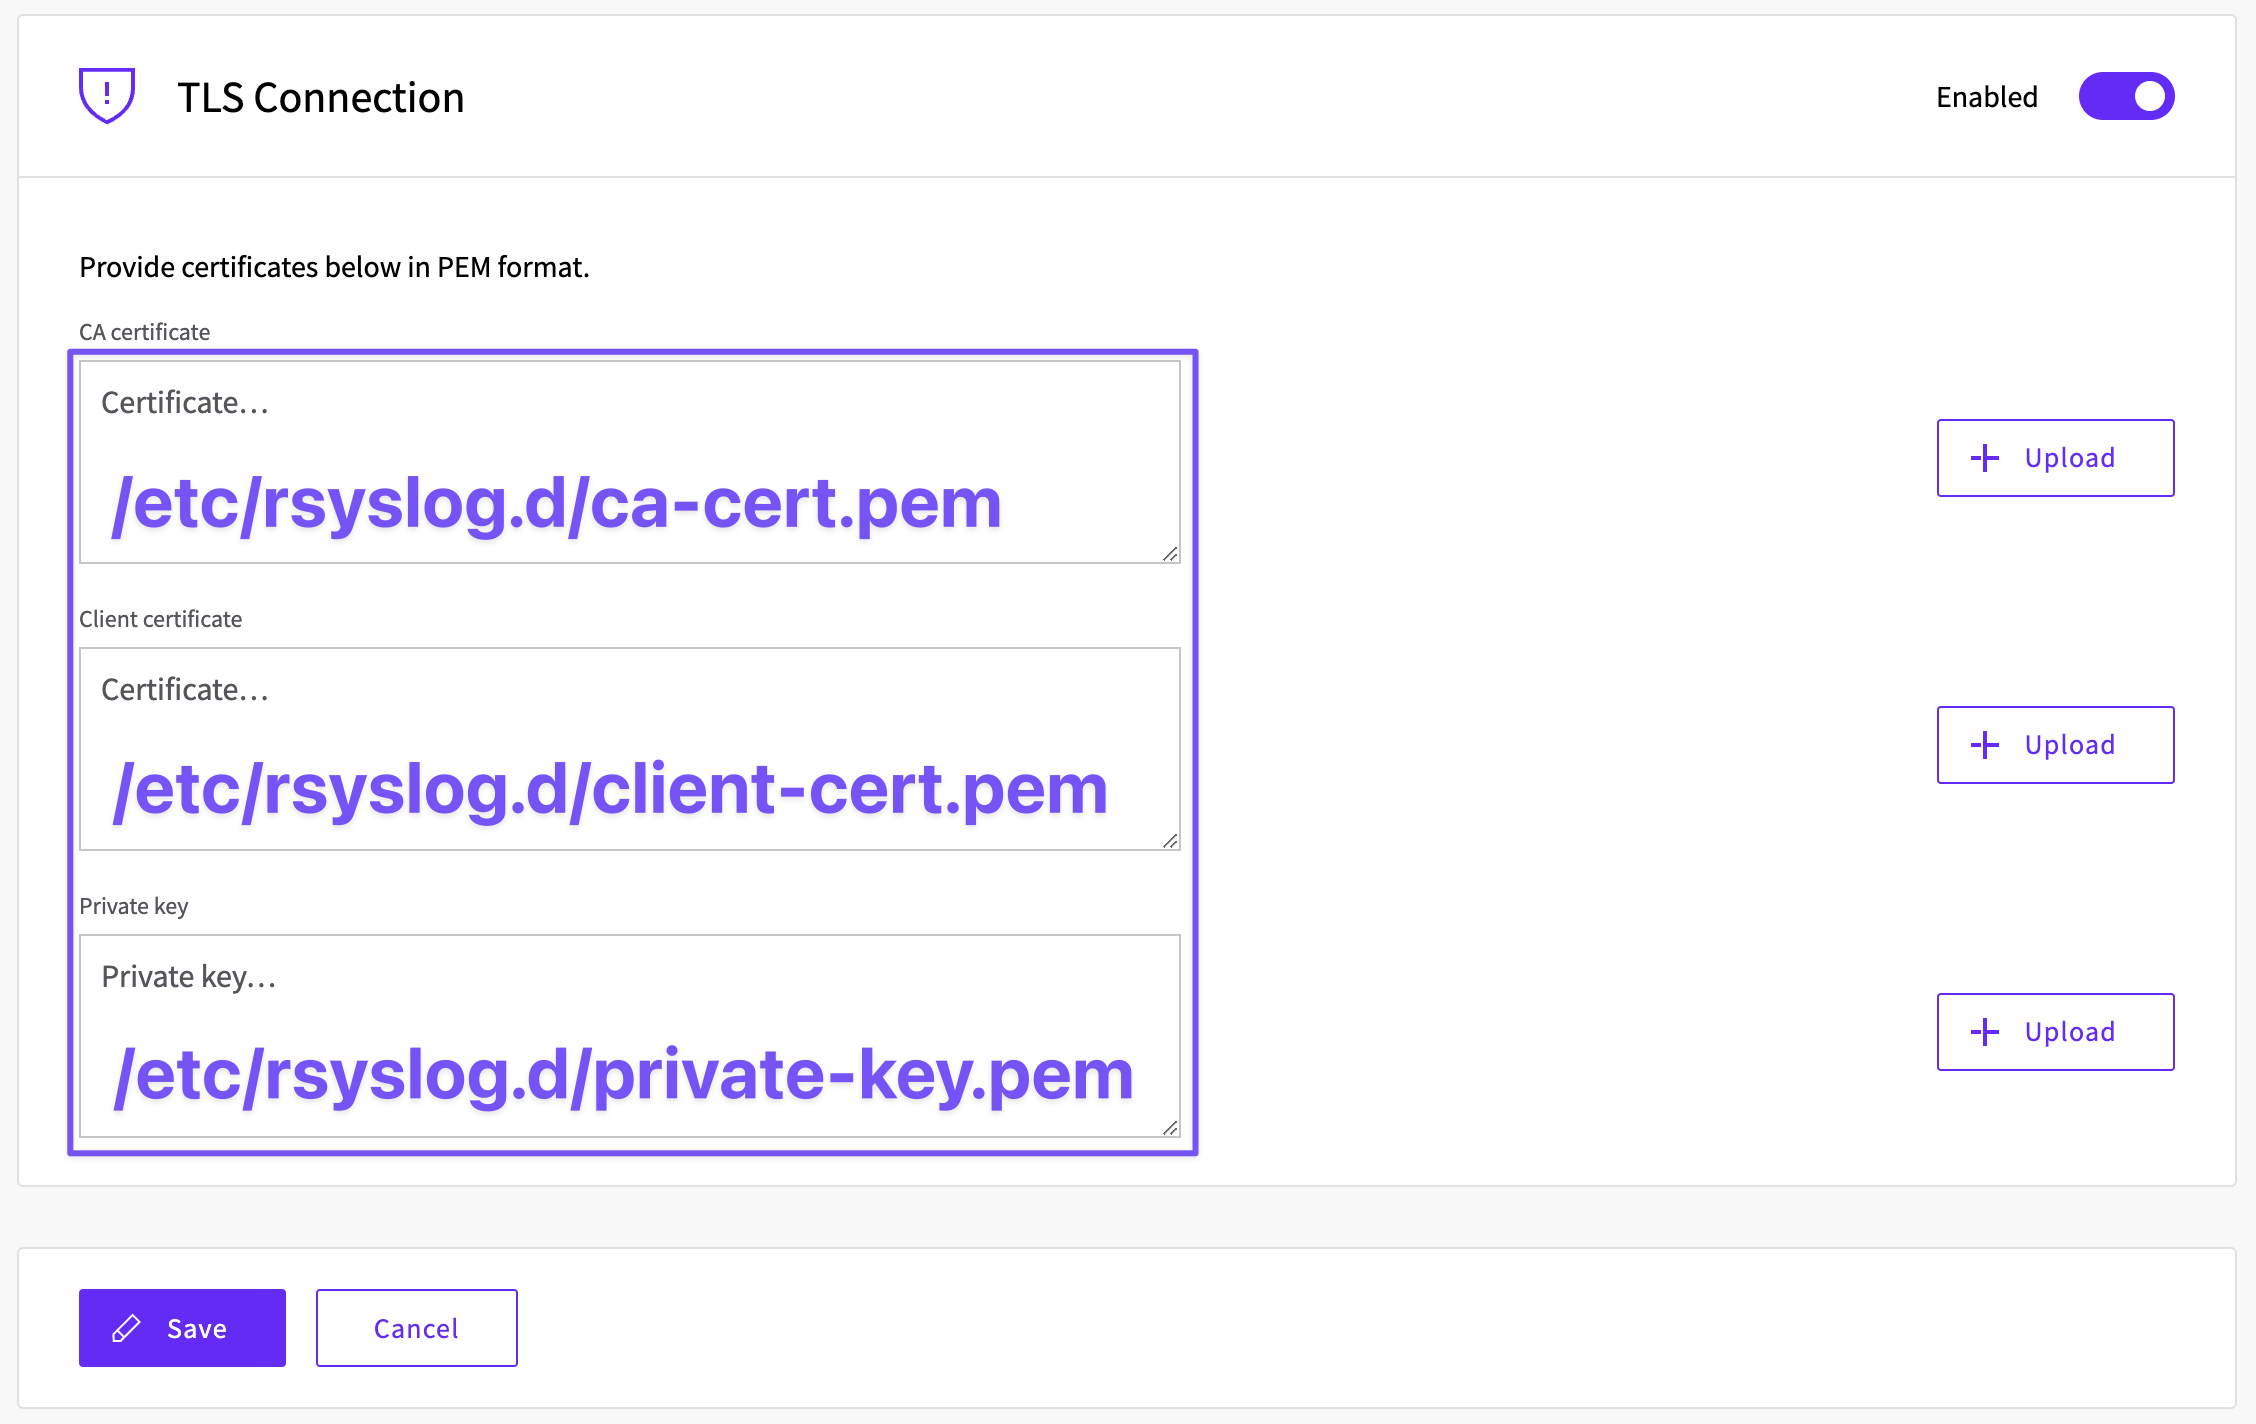
To establish a TLS connection, you will need to enter or upload the following in PEM format:
- CA certificate
- Client certificate
- Private key
You can paste them into the relevant text fields if you already have them. Otherwise, you can log into your Ryslog server to generate the files.
Before generating certificates, make sure that the GnuTLS module is installed on your rsyslog server. This module provides rsyslog with TLS encryption capabilities.
Install the module using:
# Ubuntu/Debian-based server
sudo apt update
sudo apt install rsyslog-gnutls

# CentOS/RHEL 8 and newer
sudo dnf install rsyslog-gnutls

# CentOS/RHEL 7 and older
sudo yum install rsyslog-gnutls
Then proceed with generating the necessary certificate files and keys. The steps are outlined below:
- Generate CA private key
openssl genrsa -out ca-key.pem 2048- Generate CA certificate
openssl req -new -x509 -days 365 -key ca-key.pem -out ca-cert.pem -subj "/C=US/ST=State/L=City/O=Organization/CN=rsyslog-ca"- Generate client private key
openssl genrsa -out private-key.pem 2048 - Generate client CSR
openssl req -new -key private-key.pem -out client.csr -subj "/C=US/ST=State/L=City/O=Organization/CN=rsyslog-client" - Sign the client certificate
openssl x509 -req -days 365 -in client.csr -CA ca-cert.pem -CAkey ca-key.pem -CAcreateserial -out client-cert.pemThe certificates generated using these commands will be valid for 365 days (one year). After this period, the certificates will expire, and TLS connections will fail, requiring you to generate new certificates. If you need certificates with longer validity periods, you can adjust the -days parameter in steps 2 and 5 above.
After generating new certificates, move them to the rsyslog.d folder
sudo mv ca-cert.pem /etc/rsyslog.d/
sudo mv client-cert.pem /etc/rsyslog.d/
sudo mv private-key.pem /etc/rsyslog.d/
Next, we need to configure the certificate files with the correct ownership and permissions. The certificates can be readable by others (444), but the private key should be restricted (400).
Note: For Debian-based distributions (like Ubuntu), you must complete BOTH steps below (update ownership and update permissions). For CentOS, RHEL, or other Red Hat-based distributions, skip the ownership commands and only perform the permission updates.
Update ownership: (for Debian-based distributions only)
sudo chown syslog:syslog /etc/rsyslog.d/ca-cert.pem
sudo chown syslog:syslog /etc/rsyslog.d/client-cert.pem
sudo chown syslog:syslog /etc/rsyslog.d/private-key.pem
Update permissions:
sudo chmod 444 /etc/rsyslog.d/ca-cert.pem
sudo chmod 444 /etc/rsyslog.d/client-cert.pem
sudo chmod 400 /etc/rsyslog.d/private-key.pem
Open your rsyslog configuration file with the following command:
sudo nano /etc/rsyslog.confUnder the modules section, comment out the existing lines relating to TCP reception:
# provides TCP syslog reception
#module(load="imtcp")
#input(type="imtcp" port="514")
Then, just underneath it, add the following:
# make gtls driver the default and set certificate files
global(
DefaultNetstreamDriver="gtls"
DefaultNetstreamDriverCAFile="/etc/rsyslog.d/ca-cert.pem"
DefaultNetstreamDriverCertFile="/etc/rsyslog.d/client-cert.pem"
DefaultNetstreamDriverKeyFile="/etc/rsyslog.d/private-key.pem"
)

# load TCP listener
module(
load="imtcp"
StreamDriver.Name="gtls"
StreamDriver.Mode="1"
StreamDriver.Authmode="anon"
)

# start up listener at port 514
input(
type="imtcp"
port="514"
)
Save the changes and restart rsyslog.
sudo systemctl restart rsyslogThe final step of the process requires copying the content of the certificates and private key to your UpCloud Control Panel.
You can display them in your terminal window using the commands below:
cat /etc/rsyslog.d/ca-cert.pem

cat /etc/rsyslog.d/client-cert.pem

cat /etc/rsyslog.d/private-key.pem
Important
Save the changes and return to your rsyslog server. You should start seeing activity in the syslog file now, confirming that everything is working as expected.
sudo tail -f /var/log/syslogThe whole process can be repeated several times to centralise logs from multiple databases into a single rsyslog server. This simplifies log management and makes it easier to perform comprehensive analysis or troubleshooting across your entire database ecosystem.
After centralising your logs from multiple database instances, the next step is to properly organise.
Organising logs
With logs from multiple database instances being exported in real time to rsyslog, it's important to set up proper log management and retention policies. While all logs are written to /var/log/syslog by default, it's best practice to separate logs from different database sources into their own files for better organisation.
In our example, we have two Managed PostgreSQL Database instances, both shipping their logs to the same rsyslog server:
- UserAuth database - with hostname prefix
userauth-pg - Analytics database - with hostname prefix
analytics-pg
Let's create separate log files for each database:
- Create a new rsyslog configuration file:
sudo nano /etc/rsyslog.d/45-upcloud-database.confAdd the following configuration:
# UpCloud Managed Database logging rules

# UserAuth Database logs
if $programname == 'postgres' and $hostname startswith 'userauth-pg' then {
    action(
        type="omfile"         # Defines that logs should be written to a file
        File="/var/log/upcloud/userauth-db.log"        # Path where logs will be stored
        FileCreateMode="0640" # Sets file permissions (owner:rw-, group:r--, others:---)
        FileOwner="syslog"    # Sets file owner to syslog user
        FileGroup="adm"       # Sets file group to adm
    )
    stop                      # Stops processing once rule is matched
}

# Analytics Database logs
if $programname == 'postgres' and $hostname startswith 'analytics-pg' then {
    action(
        type="omfile"
        File="/var/log/upcloud/analytics-db.log"
        FileCreateMode="0640"
        FileOwner="syslog"
        FileGroup="adm"
    )
    stop
}
The 45- prefix in the filename ensures this configuration is processed before the default rsyslog rules (which are in /etc/rsyslog.d/50-default.conf), preventing database logs from being written to /var/log/syslog.
This configuration creates separate log files for each database instance.
The if conditions check that:
- the program generating the log is postgres (
$programname == 'postgres') - the hostname matches our database instance (
$hostname startswith 'userauth-pg'or'analytics-pg')
When these conditions are met, the logs are written to their respective files with appropriate permissions and ownership. The stop directive ensures that matched logs don't continue to other rules or the default syslog file.
- Create the directory for the logs:
sudo mkdir -p /var/log/upcloud
sudo chown syslog:adm /var/log/upcloud- Set up log rotation by creating a new configuration:
sudo nano /etc/logrotate.d/upcloud-databaseAdd the following rotation policy:
# Define log files to be rotated
/var/log/upcloud/userauth-db.log /var/log/upcloud/analytics-db.log {
    daily                     # Rotate logs every day
    rotate 30                 # Keep 30 days worth of logs
    compress                  # Compress rotated logs using gzip
    delaycompress             # Don't compress the most recently rotated log
    missingok                 # Don't error if log file is missing
    notifempty                # Don't rotate empty log files
    create 0640 syslog adm    # Create new log files with these permissions
    sharedscripts             # Run postrotate script only once for all logs
    postrotate                # Script to run after rotation
        /usr/lib/rsyslog/rsyslog-rotate
    endscript
}
This configuration handles log rotation for both database log files. It ensures that:
- Logs are rotated daily to prevent files from growing too large
- 30 days of historical logs are retained before deletion
- Old logs are automatically compressed to save disk space
- Restart rsyslog to apply the changes:
sudo systemctl restart rsyslogYou can now monitor each database's logs separately by checking their respective log files.
#
tail -f /var/log/upcloud/userauth-db.log

#
tail -f /var/log/upcloud/analytics-db.log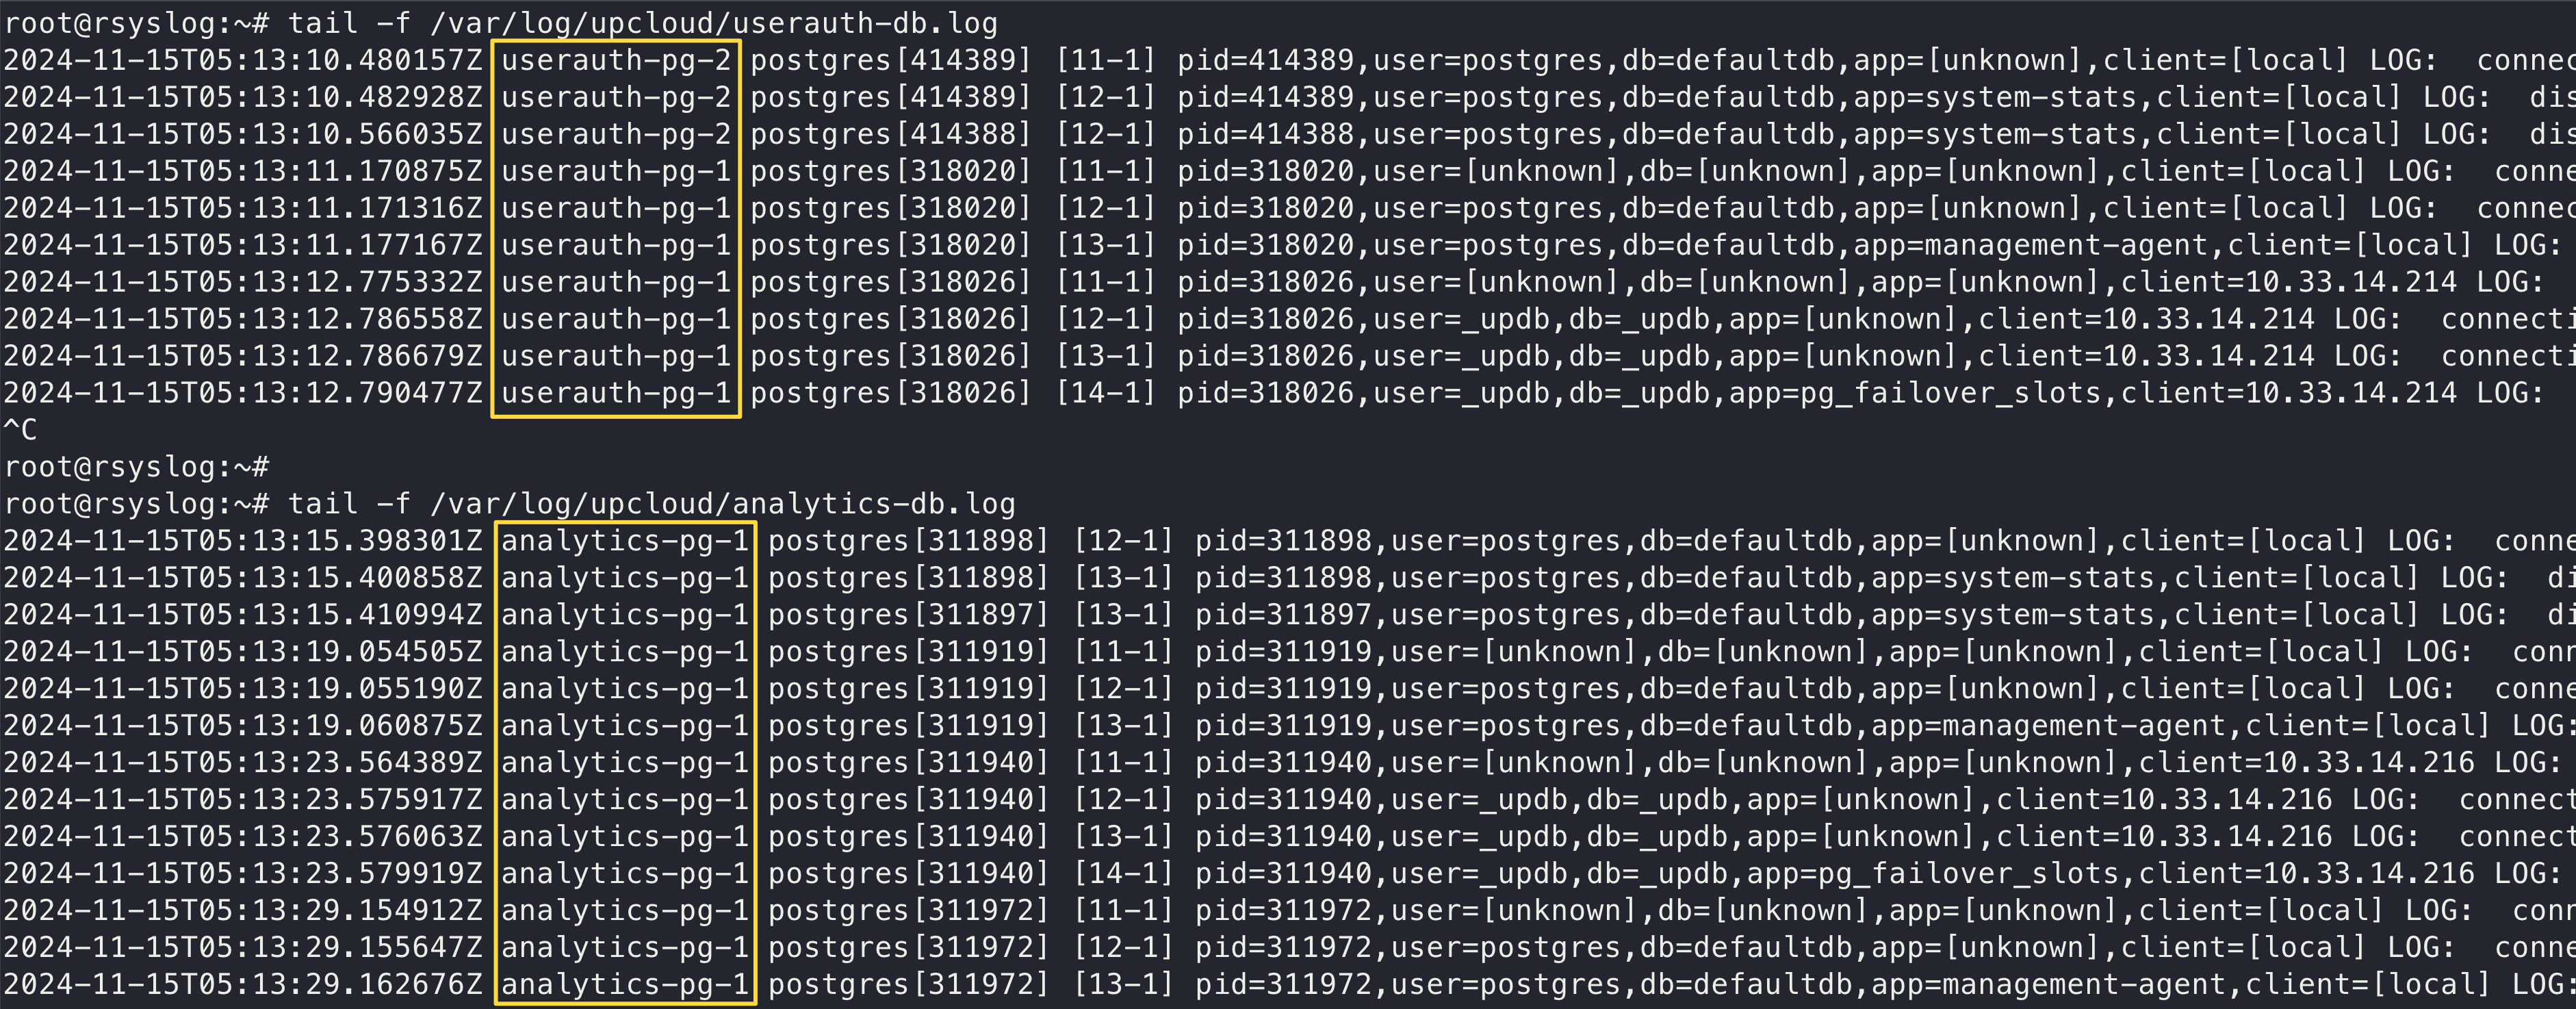
Once the log rotation policy takes effect, your log directory will be organised as follows:
/var/log/upcloud/
├── analytics-db.log          # Current active analytics log
├── analytics-db.log.1        # Yesterday's analytics log (uncompressed due to delaycompress)
├── analytics-db.log.2.gz     # 2 days ago
├── analytics-db.log.3.gz     # 3 days ago
├── analytics-db.log.4.gz     # 4 days ago
├── analytics-db.log.5.gz     # 5 days ago
├── analytics-db.log.6.gz     # 6 days ago
├── userauth-db.log           # Current active userauth log
├── userauth-db.log.1         # Yesterday's userauth log (uncompressed due to delaycompress)
├── userauth-db.log.2.gz      # 2 days ago
├── userauth-db.log.3.gz      # 3 days ago
├── userauth-db.log.4.gz      # 4 days ago
├── userauth-db.log.5.gz      # 5 days ago
└── userauth-db.log.6.gz      # 6 days ago
The logging rules and retention policies shown above are basic examples that you can use as a starting point. You can modify the settings to better match your needs - for example, you might want to keep logs for longer or shorter periods, change how often they rotate, or even the naming pattern.
For more advanced rsyslog configuration examples and options, you can refer to the official rsyslog documentation.