
How to monitor Managed Load Balancer metrics using Grafana
UpCloud shows the latest load balancer metrics in the control panel. However, you may not always want to log in to view the metrics. Therefore, exporting these to another data monitoring tool can be more convenient. In general, API queries also only return the latest value at the time the query is run. For troubleshooting, we typically want trends that can point towards an issue. So we can call the API and save the JSON response to a database, then query the database over time to see how the values fluctuate.
Prerequisites
Requirements for this tutorial:
- Access to the UpCloud API.
- UpCloud Managed Load Balancer.
- Grafana & the SQLite plugin (the data source).
- SQLite database.
- Python 3 & Pip3.
- An Ubuntu 24.04 server.
This guide is meant for an Ubuntu 24.04 server and a load balancer configuration with one frontend and two or more backends. As shown in the diagram below, testing was done using one frontend and two backends.
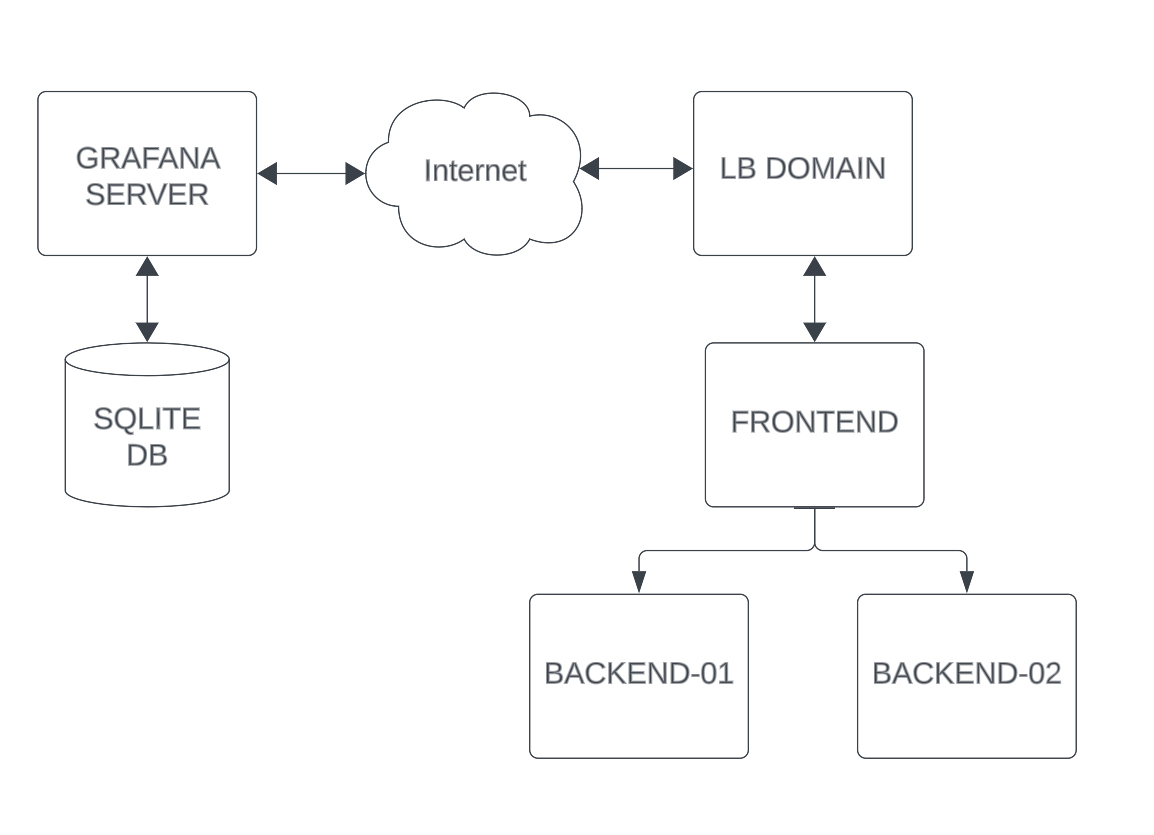
Note: You may need to modify the code below if you have multiple frontends. You must change the frontend code, as lists and nested schemas for the frontend and backend members are not allowed in SQLite and will cause errors.
Setting up an UpCloud Load Balancer subaccount
Navigate to People > Create subaccount.
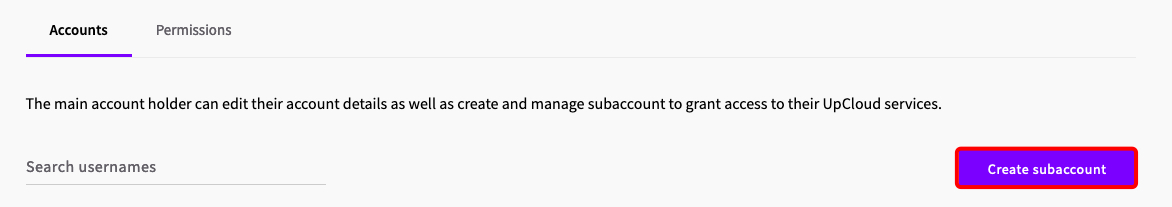
Create a new subaccount. Do not enable 2FA, as API access does not support it.
Now let's secure the subaccount a little.
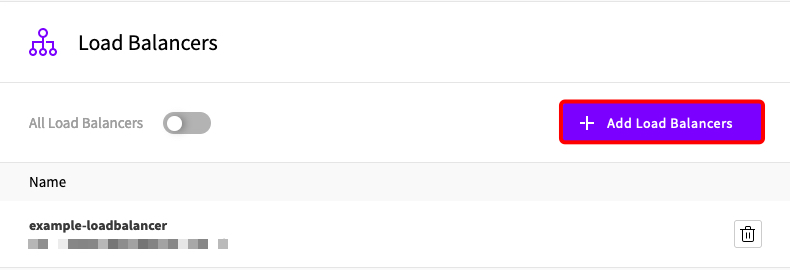
Go to the subaccount user’s Permissions page, allow API connections, and toggle off all other permissions. After that, navigate to the Load Balancers permissions and Add the Load Balancer you want the subaccount to be able to query. Block all other permissions.
We can presuppose you know how to create an Ubuntu 24.04 server on UpCloud and already have a load balancer setup that you want to monitor, so I will skip these steps.
- If you don’t know how to create a server, then refer to our tutorial here.
- If you don’t know how to create a load balancer, then refer to our tutorial here.
Installing and configuring SQLite
So why SQLite instead of something else? SQLite is easy to understand and simple enough for beginners. Grafana uses SQLite itself, but the choice of databases is arbitrary; any database will work for this.
If you have another database you want to use, then refer to the SQLAlchemy documentation on supported databases and how to connect to the database. Then modify the Python code below to reflect your changes.
Let’s begin.
sudo apt-get update && sudo apt-get install sqlite3 -yCreate the SQLite database. Try to save it in another directory other than the home directory, as Grafana will attempt to protect files in that directory. If you can't, then I will show you how to override this behaviour in the following Setup Grafana section.
sqlite3 /home/lb-metrics.dbWe are calling the database lb-metrics.db for this example, but the name can be anything.
Create and format the database tables to put the JSON API responses into. This is very simple, as all we need to do is create a table for each level of the JSON response. If you are missing a column, then there will be an error when you run the script, as it cannot write the data to the corresponding column.
CREATE TABLE frontends (
   id INTEGER PRIMARY KEY AUTOINCREMENT,
   created_at TEXT,
   current_sessions INTEGER,
   name TEXT,
   request_rate INTEGER,
   session_rate INTEGER,
   total_denied_requests INTEGER,
   total_http_requests INTEGER,
   total_http_responses_1xx INTEGER,
   total_http_responses_2xx INTEGER,
   total_http_responses_3xx INTEGER,
   total_http_responses_4xx INTEGER,
   total_http_responses_5xx INTEGER,
   total_http_responses_other INTEGER,
   total_invalid_requests INTEGER,
   total_request_bytes INTEGER,
   total_response_bytes INTEGER,
   total_sessions INTEGER,
   updated_at TEXT
);
CREATE TABLE backends (
   id INTEGER PRIMARY KEY AUTOINCREMENT,
   avg_connection_time_ms INTEGER,
   avg_queue_time_ms INTEGER,
   avg_server_response_time_ms INTEGER,
   avg_total_time_ms INTEGER,
   connections_waiting INTEGER,
   created_at TEXT,
   current_sessions INTEGER,
   name TEXT,
   session_rate INTEGER,
   total_client_aborted INTEGER,
   total_failed_checks_transitions INTEGER,
   total_failed_connections INTEGER,
   total_http_responses_1xx INTEGER,
   total_http_responses_2xx INTEGER,
   total_http_responses_3xx INTEGER,
   total_http_responses_4xx INTEGER,
   total_http_responses_5xx INTEGER,
   total_http_responses_other INTEGER,
   total_invalid_responses INTEGER,
   total_request_bytes INTEGER,
   total_response_bytes INTEGER,
   total_server_aborted INTEGER,
   total_server_connection_retries INTEGER,
   total_sessions INTEGER,
   updated_at TEXT
);
CREATE TABLE members (
   id INTEGER PRIMARY KEY AUTOINCREMENT,
   backend_name TEXT, -- Use the "backend_name" column to store the parent backend name
   name TEXT,
   avg_connection_time_ms INTEGER,
   avg_queue_time_ms INTEGER,
   avg_server_response_time_ms INTEGER,
   avg_total_time_ms INTEGER,
   check_http_code INTEGER,
   check_status TEXT,
   connections_waiting INTEGER,
   created_at TEXT,
   current_sessions INTEGER,
   session_rate INTEGER,
   status TEXT,
   total_client_aborted INTEGER,
   total_failed_checks INTEGER,
   total_failed_checks_transitions INTEGER,
   total_failed_connections INTEGER,
   total_http_responses_1xx INTEGER,
   total_http_responses_2xx INTEGER,
   total_http_responses_3xx INTEGER,
   total_http_responses_4xx INTEGER,
   total_http_responses_5xx INTEGER,
   total_http_responses_other INTEGER,
   total_invalid_responses INTEGER,
   total_request_bytes INTEGER,
   total_response_bytes INTEGER,
   total_server_aborted INTEGER,
   total_server_connection_retries INTEGER,
   total_sessions INTEGER,
   updated_at TEXT,
   FOREIGN KEY (backend_name) REFERENCES backends (name)
);
Note: The frontends and backends tables are cumulative for the entire load balancer. The members table provides a more granular look at the individual backend server or, if configured, frontend members.
Check that the SQLite tables were created successfully.
.schemaExit the database.
.exitNote: 24 hours of logs is ~500kb of disk storage.
Set up the Python script
Update your repositories and install python3 and pip3.
sudo apt-get update && sudo apt-get install python3 python3-pip -yInstall the required Python libraries.
pip3 install requests pandas sqlalchemyNote: If you receive a message that the environment is externally managed, you may want to install these packages via a virtual environment or install the packages via apt.
Create a file called lb-metrics.py and add this code to it. Remember to update the lb_uuid and token variables. The example below authenticates with an API token (recommended). If you prefer to use the username and password of a dedicated UpCloud subaccount instead, see the alternative snippet further below.
import requests
import pandas as pd
import sqlalchemy
import sys
import logging
import datetime

# --- Configuration ---
lb_uuid = "CHANGE_TO_YOUR_LOAD_BALANCER_UUID"
token = "CHANGE_TO_YOUR_UPCLOUD_API_TOKEN" # Keep your token secure
db_path = "sqlite:////home/lb-metrics.db" # Using absolute path
api_url = f"https://api.upcloud.com/1.3/load-balancer/{lb_uuid}/metrics"
headers = {"Authorization": f"Bearer {token}"}

# --- Logging Setup ---
# Configure basic logging: INFO level and above, specific format and date format.
log_format = '%(asctime)s - %(message)s'
logging.basicConfig(level=logging.INFO, format=log_format, datefmt='%Y-%m-%d %H:%M:%S')

# --- Database Engine ---
engine = sqlalchemy.create_engine(db_path)

# --- Main Logic ---
try:
   logging.info(f"Fetching data from {api_url}...")
   response = requests.get(api_url, headers=headers)
   response.raise_for_status()
   logging.info("API request successful.")
   data = response.json()

   with engine.connect() as connection:
       with connection.begin() as transaction:
           try:
               # --- Process Frontends ---
               if "frontends" in data and data["frontends"]: # Also check if the list is not empty
                   frontends_data = data["frontends"]
                   frontends_df = pd.DataFrame(frontends_data)
                   logging.info("Preparing to write Frontends...")
                   # print(frontends_df.to_string()) # Debug print (optional)
                   frontends_df.to_sql(name="frontends", index=False, con=connection, if_exists="append")
                   logging.info("Data appended to 'frontends' table.")
               else:
                   logging.info("No 'frontends' data found or data is empty in the JSON response.")

               # --- Process Backends and Members ---
               if "backends" in data and data["backends"]: # Also check if the list is not empty
                   backends_data = data["backends"]

                   # Prepare lists for DataFrames
                   backends_list_for_df = []
                   members_list_for_df = []

                   for backend_entry in backends_data:
                       # Create a copy to avoid modifying the original dict
                       backend_dict = backend_entry.copy()
                       # Extract members and remove from the backend dict
                       members_data = backend_dict.pop("members", [])
                       # Add the backend dict (without members) to the list
                       backends_list_for_df.append(backend_dict)

                       # Process members if they exist
                       backend_name = backend_entry.get("name") # Get the parent backend name
                       if backend_name: # Ensure the backend has a name
                           for member_entry in members_data:
                               member_dict = member_entry.copy()
                               member_dict["backend_name"] = backend_name # Add the foreign key value
                               members_list_for_df.append(member_dict)
                       else:
                            # Use logging.warning for non-critical issues
                            logging.warning(f"Backend found without a name, cannot link members: {backend_entry}")

                   # Write Backends DataFrame if data exists
                   if backends_list_for_df:
                       backends_df = pd.DataFrame(backends_list_for_df)
                       logging.info("Preparing to write Backends...")
                       # print(backends_df.to_string()) # Debug print (optional)
                       backends_df.to_sql(name="backends", index=False, con=connection, if_exists="append")
                       logging.info("Data appended to 'backends' table.")
                   else:
                       logging.info("No backends processed (list was empty).")

                   # Write Members DataFrame if data exists
                   if members_list_for_df:
                       members_df = pd.DataFrame(members_list_for_df)
                       logging.info("Preparing to write Members...")
                       # print(members_df.to_string()) # Debug print (optional)
                       members_df.to_sql(name="members", index=False, con=connection, if_exists="append")
                       logging.info("Data appended to 'members' table.")
                   else:
                       logging.info("No members processed (list was empty).")

               else:
                   logging.info("No 'backends' data found or data is empty in the JSON response.")

               logging.info("Transaction commit initiated.")
               # transaction.commit() # Commit is handled by the context manager

           except Exception as e:
               # Log errors using logging.error
               logging.error(f"Error during database write operation: {e}", exc_info=True) # exc_info=True adds traceback
               logging.error("Transaction will be rolled back.")
               # transaction.rollback() # Rollback is handled by the context manager
               raise # Re-raise the exception to be caught by the outer block

# --- Error Handling ---
except requests.exceptions.RequestException as e:
   logging.error(f"API Request failed: {e}", exc_info=True)
except sqlalchemy.exc.SQLAlchemyError as e:
   logging.error(f"Database connection or operation failed: {e}", exc_info=True)
except Exception as e:
   # Catch any other unexpected errors
   logging.error(f"An unexpected error occurred: {e}", exc_info=True)

logging.info("Script finished.")
Alternative: using username and password
If you prefer to use the traditional authentication method instead of an API token, replace the token variable and headers dictionary above with the following, using credentials from a dedicated UpCloud subaccount (create one if you don't have one):
username = "CHANGE_TO_YOUR_USERNAME"
password = "CHANGE_TO_YOUR_PASSWORD"
Then change the request line from response = requests.get(api_url, headers=headers) to response = requests.get(api_url, auth=(username, password)).
Test that the Python script is working and that no errors are being printed to the console.
python3 lb-metrics.pyVerify that the script is writing the API responses to the SQLite database by connecting to the local database.
sqlite3 /home/lb-metrics.dbThen run this SQL to ensure everything is working as intended.
SELECT * FROM members;If you are successful, then continue to the next steps.
Note: In the code, four slashes (sqlite:////…) is used by SQLAlchemy for the absolute path to the database and three slashes for the relative path.
Again, if you have another database you want to use, then refer to the SQLAlchemy documentation on supported databases and how to connect to the database. Then modify the Python code above to reflect your changes.
Set up a cronjob
Create a cronjob to run this code.
crontab -eAdd this line to the crontab file. This will run the code every minute.
* * * * * /bin/python3 /PATH/TO/YOUR/SCRIPT/lb-metrics.py >> /var/log/lb-metrics-out.txt 2>&1We are also adding a file called lb-metrics-out.txt which will print out what the script is doing. This is useful for troubleshooting any errors if the code is not working. Without a full file path, by default, the file will be written to the current users home directory: $HOME/lb-metrics-out.txt. This is optional, so if you don’t want this file, then leave out everything after the path to the lb-metrics.py file.
Save and exit.
If the script is working, your logs will be in this format:
2025-05-02 23:00:01 - Fetching data from https://api.upcloud.com/1.3/load-balancer/{uuid}/metrics...
2025-05-02 23:00:03 - API request successful.
2025-05-02 23:00:03 - Preparing to write Frontends...
2025-05-02 23:00:03 - Data appended to 'frontends' table.
2025-05-02 23:00:03 - Preparing to write Backends...
2025-05-02 23:00:03 - Data appended to 'backends' table.
2025-05-02 23:00:03 - Preparing to write Members...
2025-05-02 23:00:03 - Data appended to 'members' table.
2025-05-02 23:00:03 - Transaction commit initiated.
2025-05-02 23:00:03 - Script finished.
Check that the job was saved successfully.
crontab -lIf you run into any errors, and lb-metrics-out.txt doesn’t help you narrow down the issue. I find that running the command in crontab helps.
/bin/python3 /PATH/TO/YOUR/SCRIPT/lb-metrics.pySetup Grafana
If you already have Grafana installed on your server, then skip this step; otherwise, refer to Grafana’s Ubuntu installation guide here. Refer to the best security practices here. Please ensure you keep your dashboard secure.
We’ll use the SQLite plugin by Sergej Herbert. Link to their GitHub here.
Install the plugin via the command line.
grafana-cli plugins install frser-sqlite-datasourceRestart Grafana.
systemctl restart grafana-serverOn your browser, navigate to your server IP and port 3000. If this is a new install, the default Grafana credentials are admin:admin.
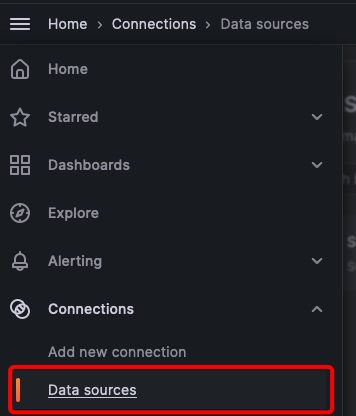
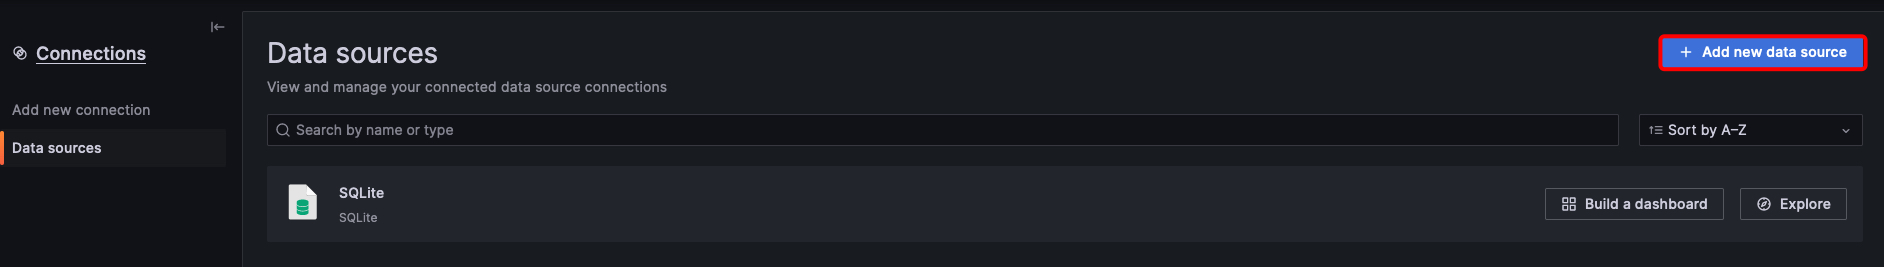
Go to Connections > Data sources.
Then click on the Add data source button.
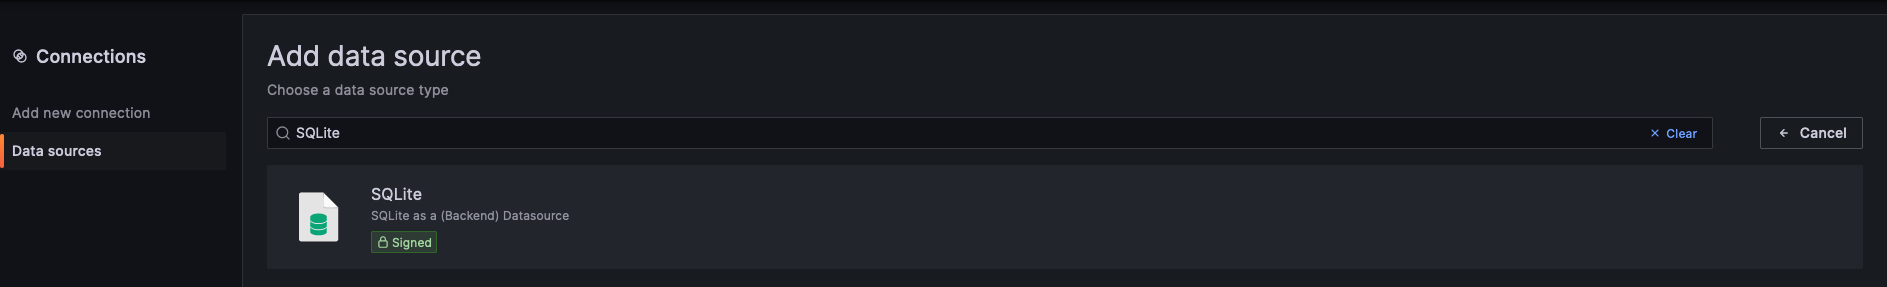
Search for SQLite.
Add the path to your database and click Save & Test. If successful, you should see this screen.
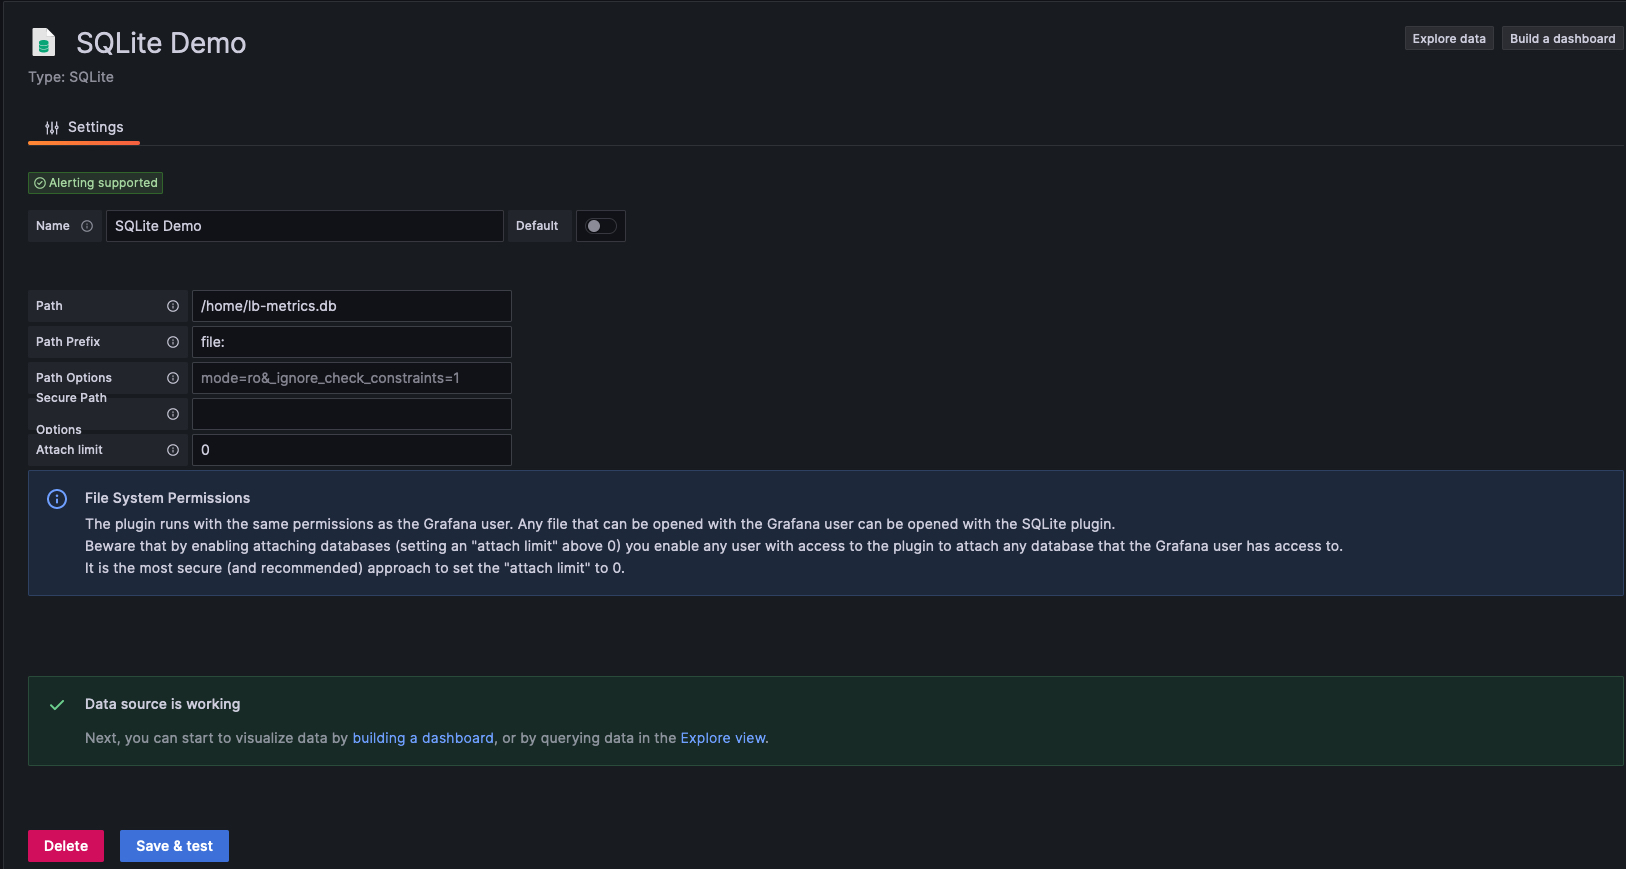
If not then you will need to fix the error and try again. Some common errors are “file not found” and “permission denied”. Refer to the SQLite plugin troubleshooting documentation.
Now let’s build a dashboard…

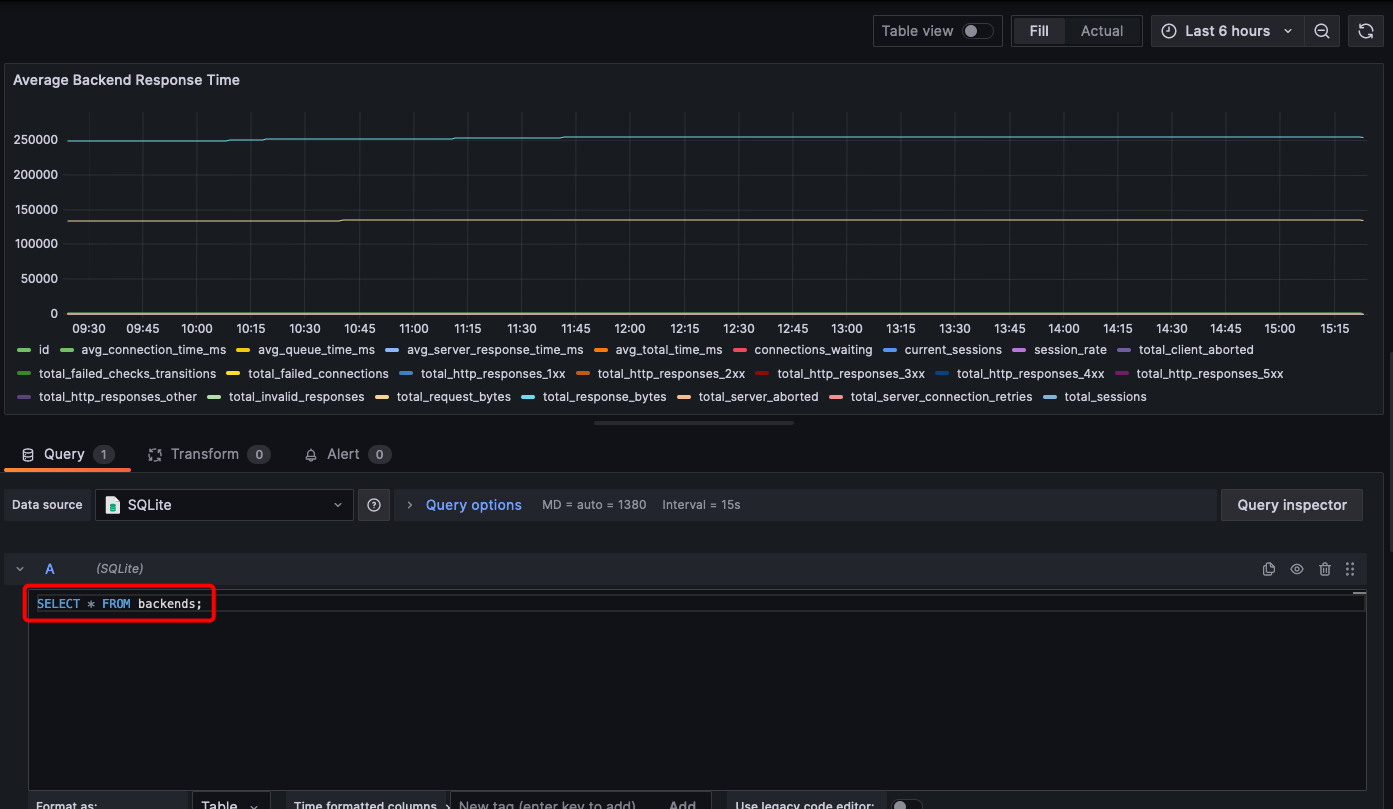
Click on Add visualisation and select your SQLite data source.
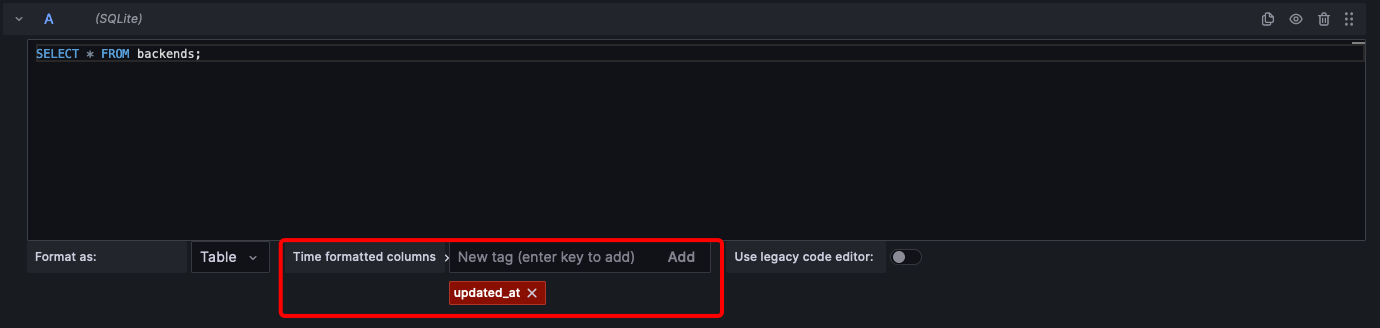
You will use the same SQL syntax as you do for SQLite. For example:
To enable monitoring over time, you need a column that should be used for timekeeping. Set the updated_at column as the time formatted column here:
That’s it! Now you have a dashboard for monitoring your load balancer metrics using Grafana.