
This guide is based on the original example by Joni Jääskeläinen, published in the now archived uks-instructions repository. The Terraform configuration and the overall approach are from that example.
How to ship Managed Kubernetes logs to Managed OpenSearch with Fluent Bit
This guide shows how to collect the container logs from a Managed Kubernetes cluster and send them to a Managed OpenSearch database. Terraform creates the database and a dedicated fluentbit user, and writes a Helm values file. Helm then installs Fluent Bit on the cluster using that file.
Everything you need is on this page. You do not need to clone a repository.
Prerequisites
You need:
- A running Managed Kubernetes cluster and its kubeconfig file
- Terraform 1.0 or later
- Helm 3 or later
- An API token for your UpCloud account
Export the token and the path to your kubeconfig:
export UPCLOUD_TOKEN=ucat_your_api_token
export KUBECONFIG=/path/to/your/kubeconfig.yaml
If you prefer username and password authentication with an API subaccount, export UPCLOUD_USERNAME and UPCLOUD_PASSWORD instead of UPCLOUD_TOKEN. The Terraform configuration below works with either.
Create the project
Create a directory for the project with a terraform subdirectory:
mkdir -p uks-logging/terraform
cd uks-logging
The finished layout looks like this:
uks-logging/
└── terraform/
    ├── config.tfvars
    ├── main.tf
    ├── outputs.tf
    └── variables.tf
Create the four files below inside terraform/.
terraform/variables.tf
variable "zone" {
  description = "UpCloud zone for the OpenSearch database, for example fi-hel2"
  type        = string
}

variable "opensearch_plan" {
  description = "Managed OpenSearch plan, for example 1x2xCPU-4GB-80GB-1D"
  type        = string
}
terraform/config.tfvars
Set the zone and plan you want. Use the same zone as your Kubernetes cluster to keep traffic in-region.
zone            = "fi-hel2"
opensearch_plan = "1x2xCPU-4GB-80GB-1D"
The plan identifiers you can use for opensearch_plan are listed on the Managed OpenSearch configurations page.
terraform/main.tf
This file creates the database, a fluentbit user restricted to the uks index, and a local Helm values file with the connection details.
terraform {
  required_providers {
    upcloud = {
      source  = "UpCloudLtd/upcloud"
      version = "~> 5.20" # tested with 5.44.0
    }
    local = {
      source  = "hashicorp/local"
      version = "~> 2.5"
    }
  }
}

provider "upcloud" {
  # Credentials are read from UPCLOUD_TOKEN, or from
  # UPCLOUD_USERNAME and UPCLOUD_PASSWORD, in the environment.
}

resource "upcloud_managed_database_opensearch" "logs" {
  # name is used in the service hostname; title is what the Control Panel shows.
  name  = "opensearch-uks-logs"
  title = "OpenSearch for Managed Kubernetes logs"
  plan  = var.opensearch_plan
  zone  = var.zone

  # Enforce per-user index permissions.
  access_control = true

  # Leave off. The fluentbit user is granted _bulk access by its own rule below,
  # which is narrower than opening _bulk for every user.
  extended_access_control = false

  properties {
    # Required to reach OpenSearch Dashboards from your browser.
    public_access = true

    # Allows connections from anywhere. For production, restrict this to the
    # public IP addresses of your worker nodes.
    ip_filter = ["0.0.0.0/0"]
  }
}

resource "upcloud_managed_database_user" "fluentbit" {
  service  = upcloud_managed_database_opensearch.logs.id
  username = "fluentbit"

  opensearch_access_control {
    rules {
      index      = "uks*"
      permission = "readwrite"
    }
    rules {
      # Fluent Bit posts to /_bulk, so the uks* rule alone is not enough.
      index      = "_bulk*"
      permission = "readwrite"
    }
  }
}

# Helm values file for the fluent-bit chart. It replaces the chart's
# default outputs with a single OpenSearch output.
resource "local_file" "fluentbit_helm_values" {
  filename        = "${path.module}/opensearch-fluentbit-helm-values.yaml"
  file_permission = "0600"
  content         = <<-EOT
    config:
      outputs: |
        [OUTPUT]
            Name opensearch
            Match *
            Host ${upcloud_managed_database_opensearch.logs.service_host}
            Port ${upcloud_managed_database_opensearch.logs.service_port}
            HTTP_User ${upcloud_managed_database_user.fluentbit.username}
            HTTP_Passwd ${upcloud_managed_database_user.fluentbit.password}
            tls On
            Suppress_Type_Name On
            Index uks
            Replace_Dots On
            Trace_Error Off
  EOT
}
terraform/outputs.tf
output "opensearch_host" {
  value = upcloud_managed_database_opensearch.logs.service_host
}

output "opensearch_port" {
  value = upcloud_managed_database_opensearch.logs.service_port
}

output "fluentbit_username" {
  value = upcloud_managed_database_user.fluentbit.username
}
Deploy Managed OpenSearch
Run all Terraform commands from the terraform directory.
cd terraform
terraform init
Review the plan. You should see three resources: the database, the user, and the local file.
terraform plan -var-file=config.tfvarsApply it. Creating the database takes a few minutes.
terraform apply -var-file=config.tfvarsWhen the apply finishes, terraform/opensearch-fluentbit-helm-values.yaml exists. It contains the fluentbit user's password, so keep it out of version control.
Install Fluent Bit
Move back to the project root and install the Fluent Bit chart into its own namespace, using the generated values file:
cd ..
helm repo add fluent https://fluent.github.io/helm-charts
helm repo update
helm install fluent-bit fluent/fluent-bit \
  --namespace fluent-bit \
  --create-namespace \
  --values terraform/opensearch-fluentbit-helm-values.yaml
Fluent Bit runs as a DaemonSet, one pod per worker node. Check they are all running:
kubectl get pods -n fluent-bitCheck the pod logs for errors. A healthy pod shows the tail input and kubernetes filter starting and no [error] or [warn] lines. The opensearch output only logs when something fails, so no output lines is the expected result:
kubectl logs -n fluent-bit -l app.kubernetes.io/name=fluent-bit --tail=50The chart's default tail input reads /var/log/containers/*.log on each node, and the default kubernetes filter adds pod, namespace and container metadata to every record. The chart also ships a systemd input for kubelet logs, but it reads nothing on Managed Kubernetes nodes: the journal is volatile under /run/log/journal, which the chart does not mount. Only container logs are shipped. The generated values file replaces the chart's outputs and leaves inputs and filters at their defaults. To change inputs or filters, copy the generated file, edit it, and pass your copy to helm upgrade. The full list of options is in the chart's values.yaml.
View logs in OpenSearch Dashboards
Access control is enabled on the database, so the fluentbit user can only reach the uks index. The primary upadmin user has admin rights on all indices by default, so no change is needed to view the logs. You can confirm this in the UpCloud Control Panel under the database's Users tab: fluentbit has the two rules from the Terraform configuration and upadmin has one rule granting admin on everything. Click Access control next to a user to see its rules.
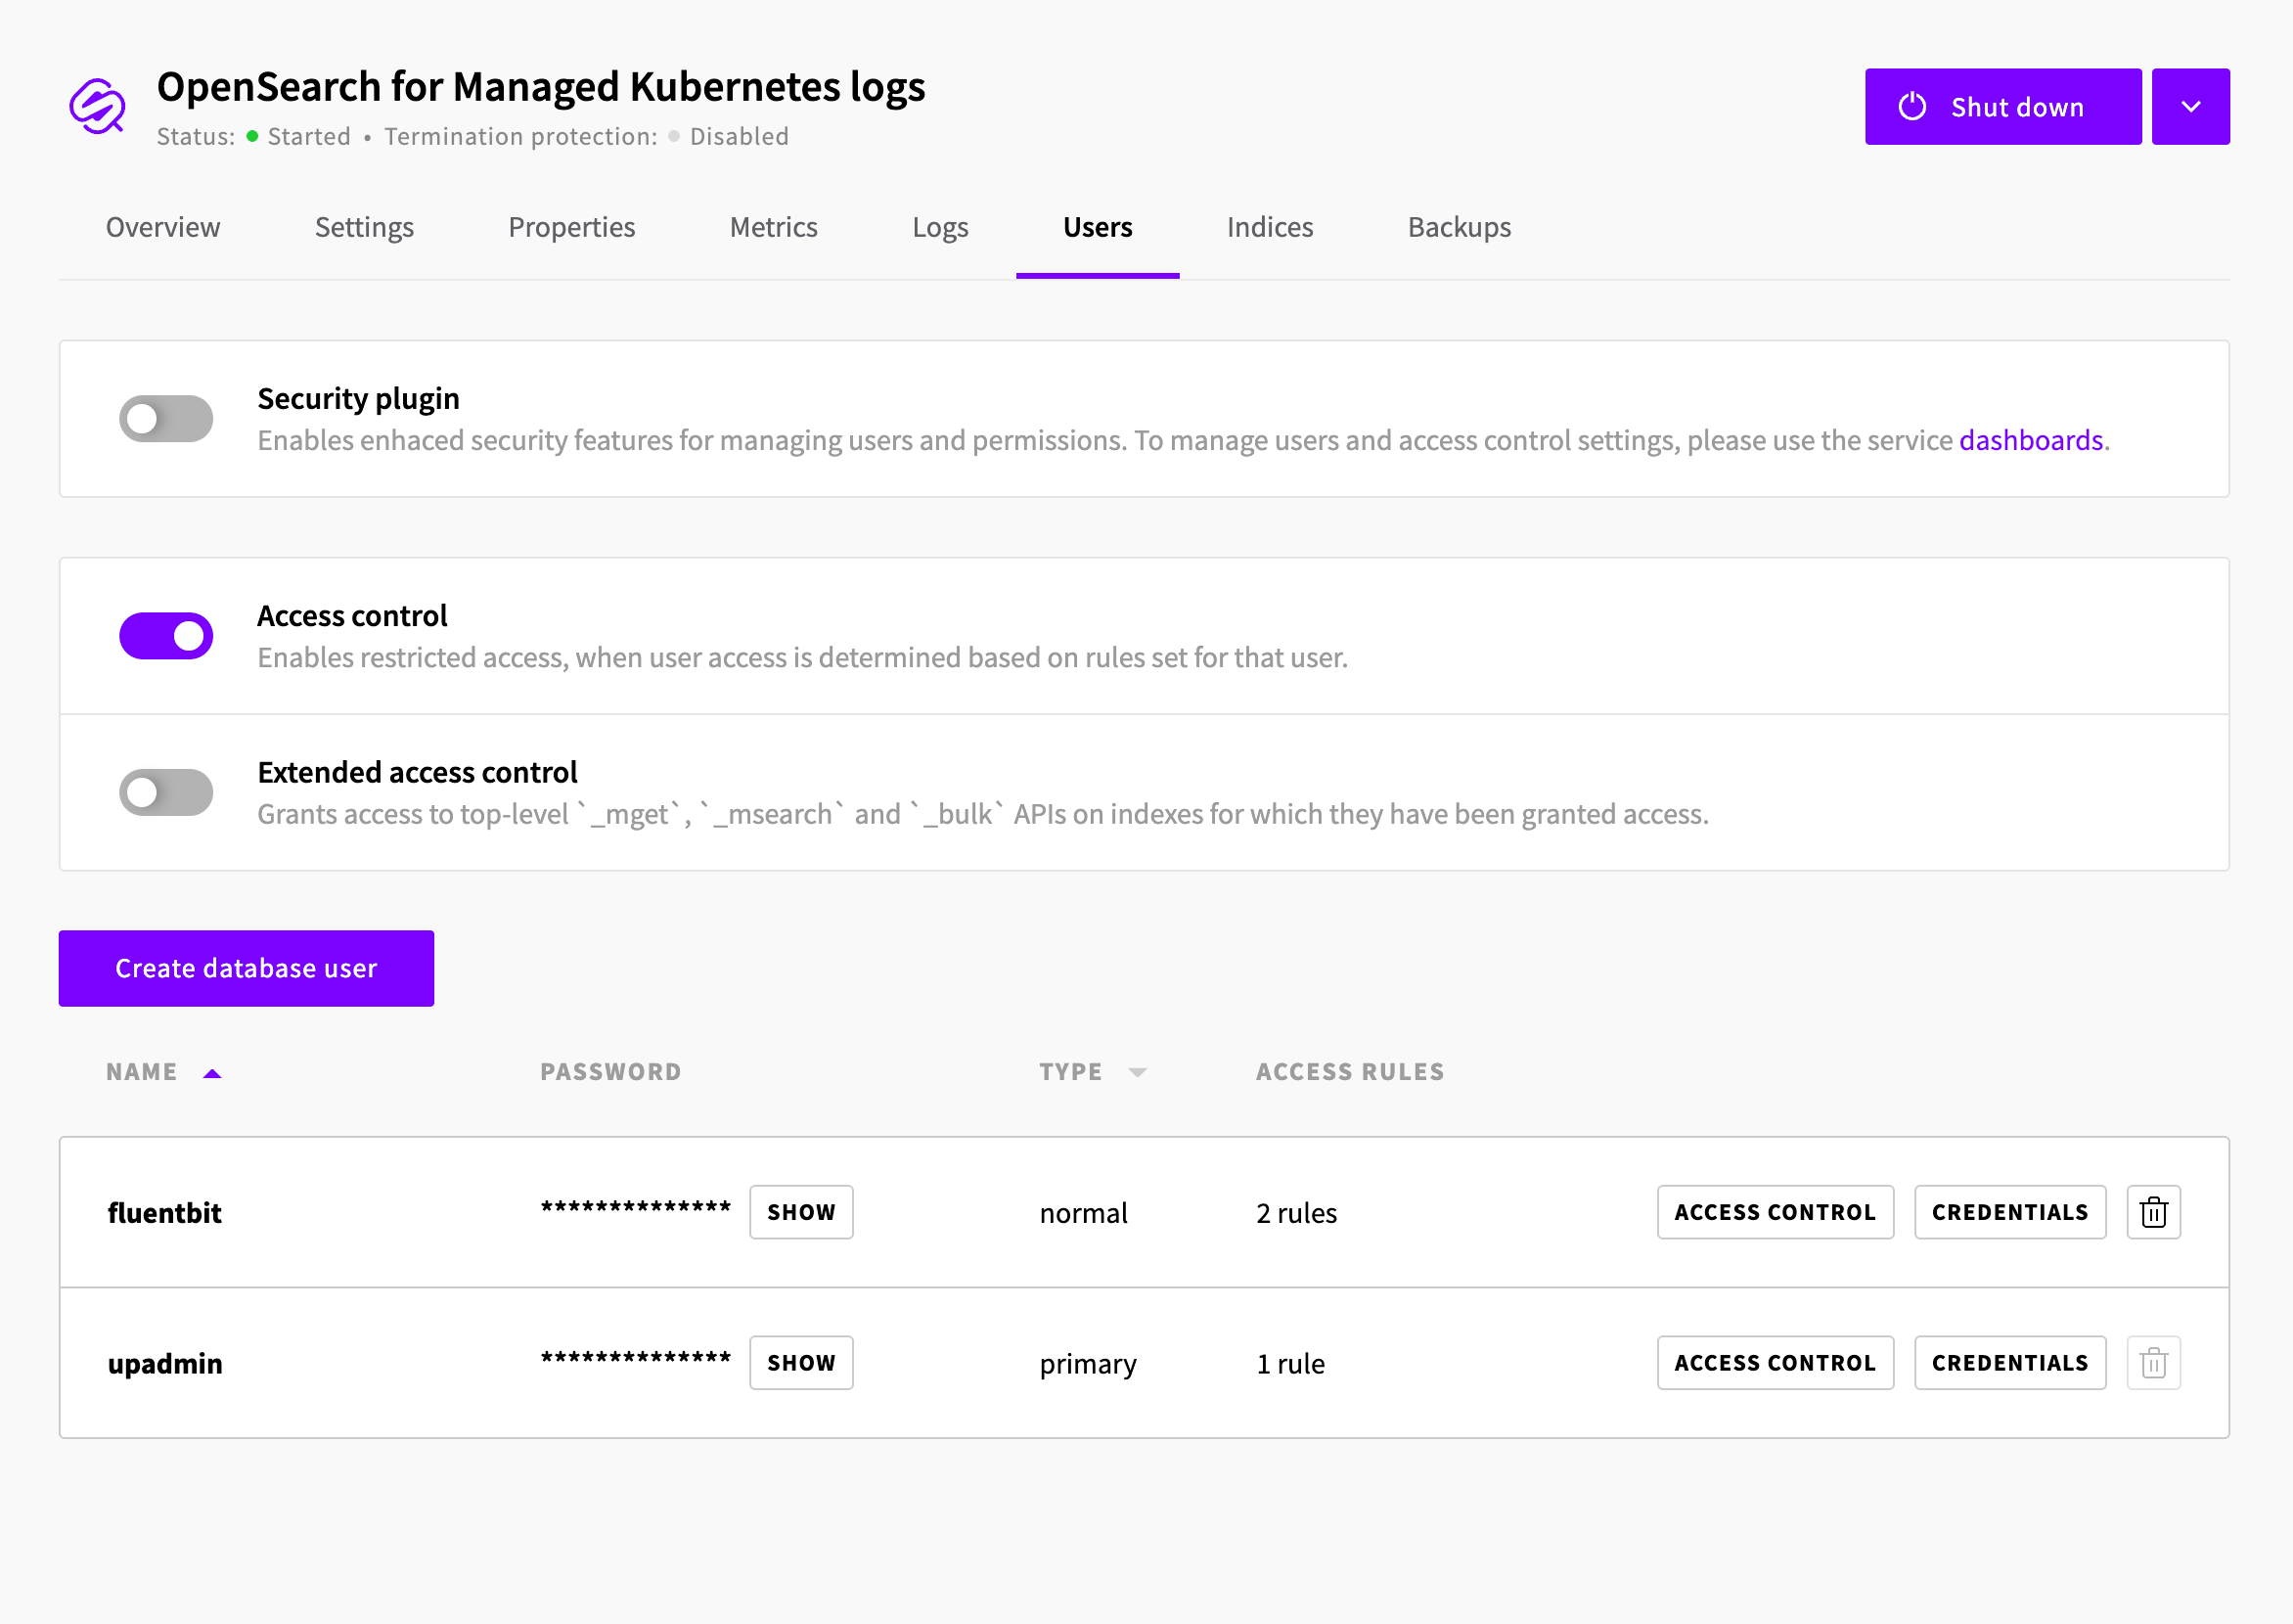
Open the OpenSearch for Managed Kubernetes logs database in the Control Panel, copy the
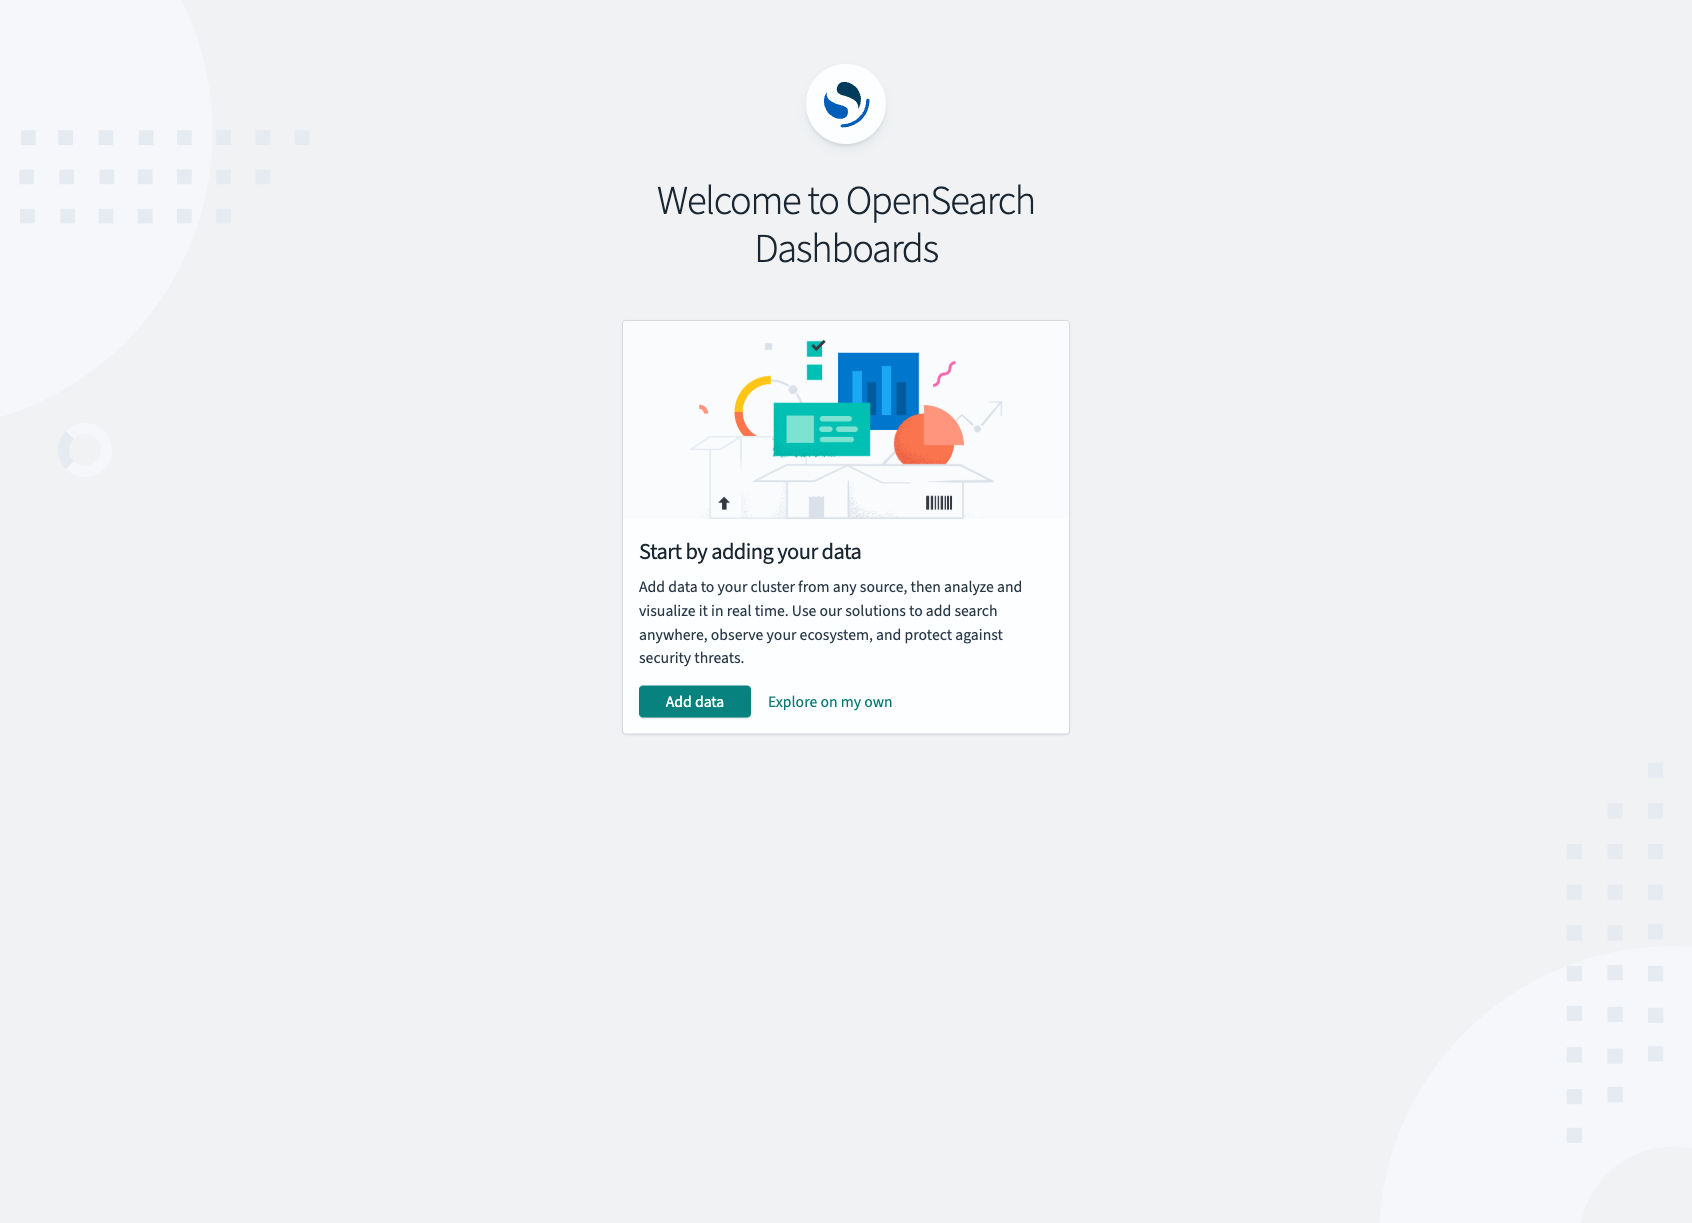
upadminpassword from the Overview tab, and click Go to dashboard. Dashboards are served on thepublic-prefixed hostname; the plain service hostname resolves to a private address and is not reachable from a browser.Log in as
upadmin.On first login OpenSearch Dashboards shows a welcome screen. Click Explore on my own. The logs are already in the cluster, so Add data is not needed.
A Select your tenant dialog appears next. Choose Global if other dashboards users should see the index pattern you are about to create, then click Confirm. The default is Private, which keeps the pattern visible only to
upadminin this browser. You can switch later from the avatar menu in the top right under Switch tenants.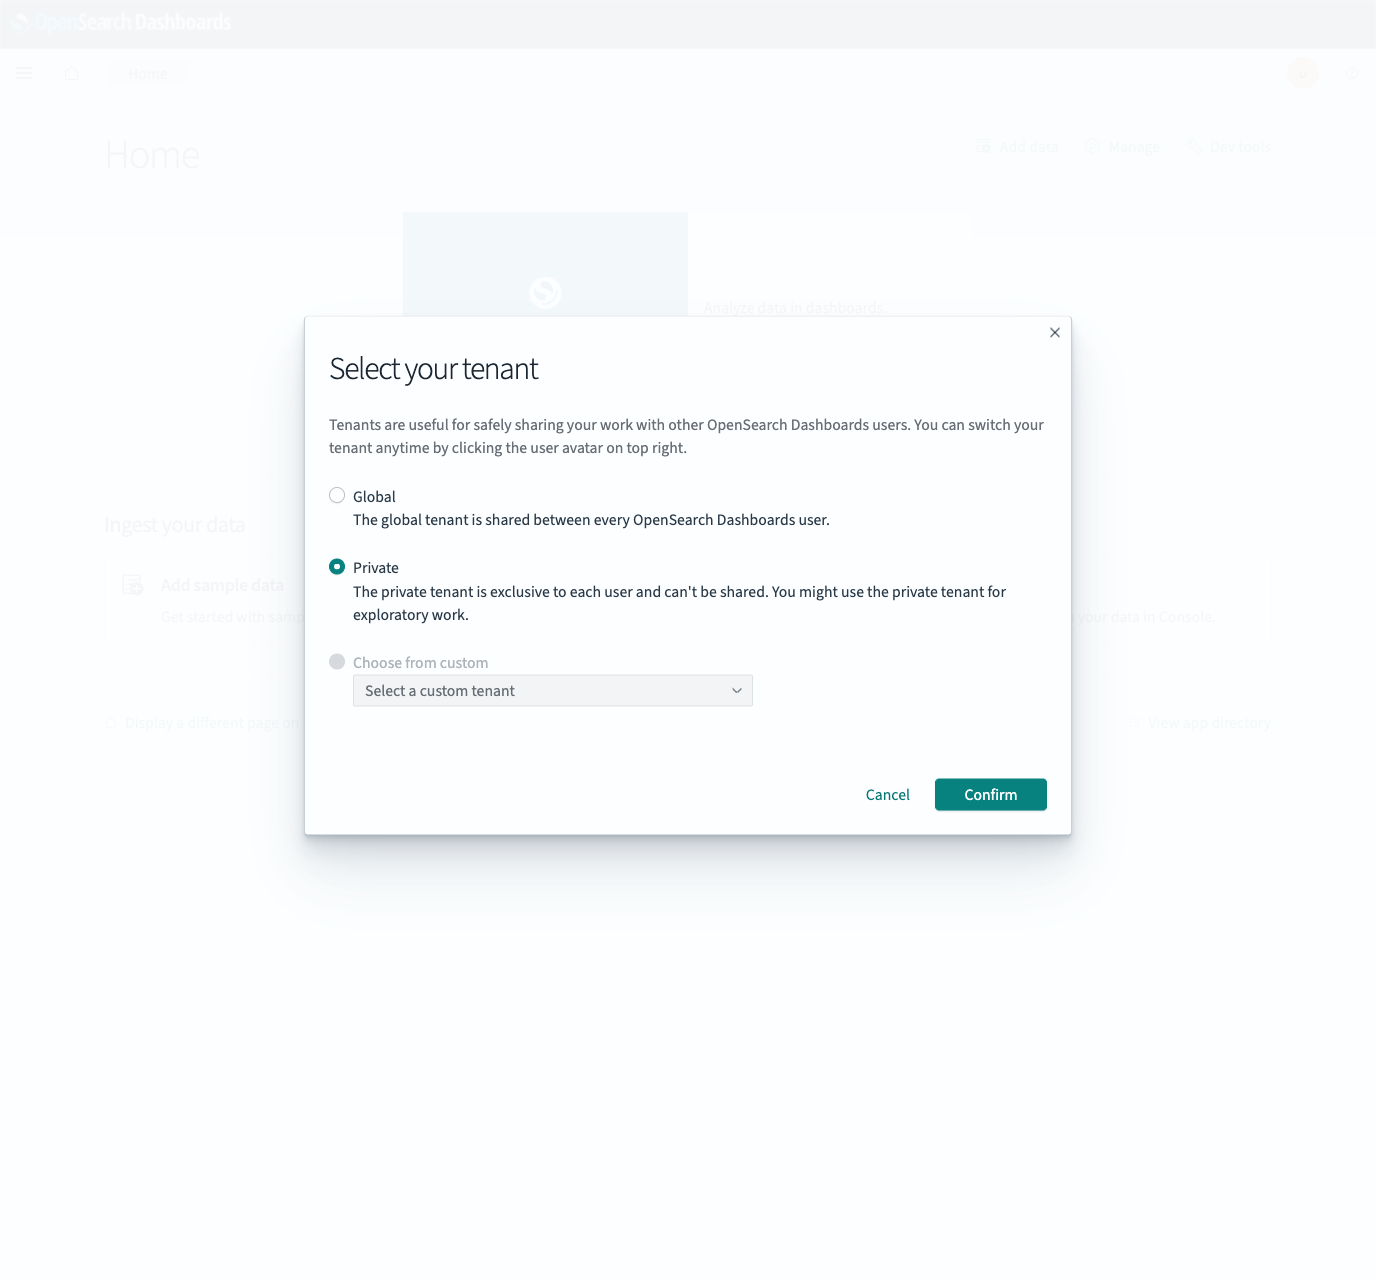
Open the menu in the top left, go to Dashboards Management, then Index patterns, and click Create index pattern.
Step 1: keep Use default data source selected and click Next step.
Step 2: enter
uks*in Index pattern name. The page confirms it matches theuksindex. Click Next step.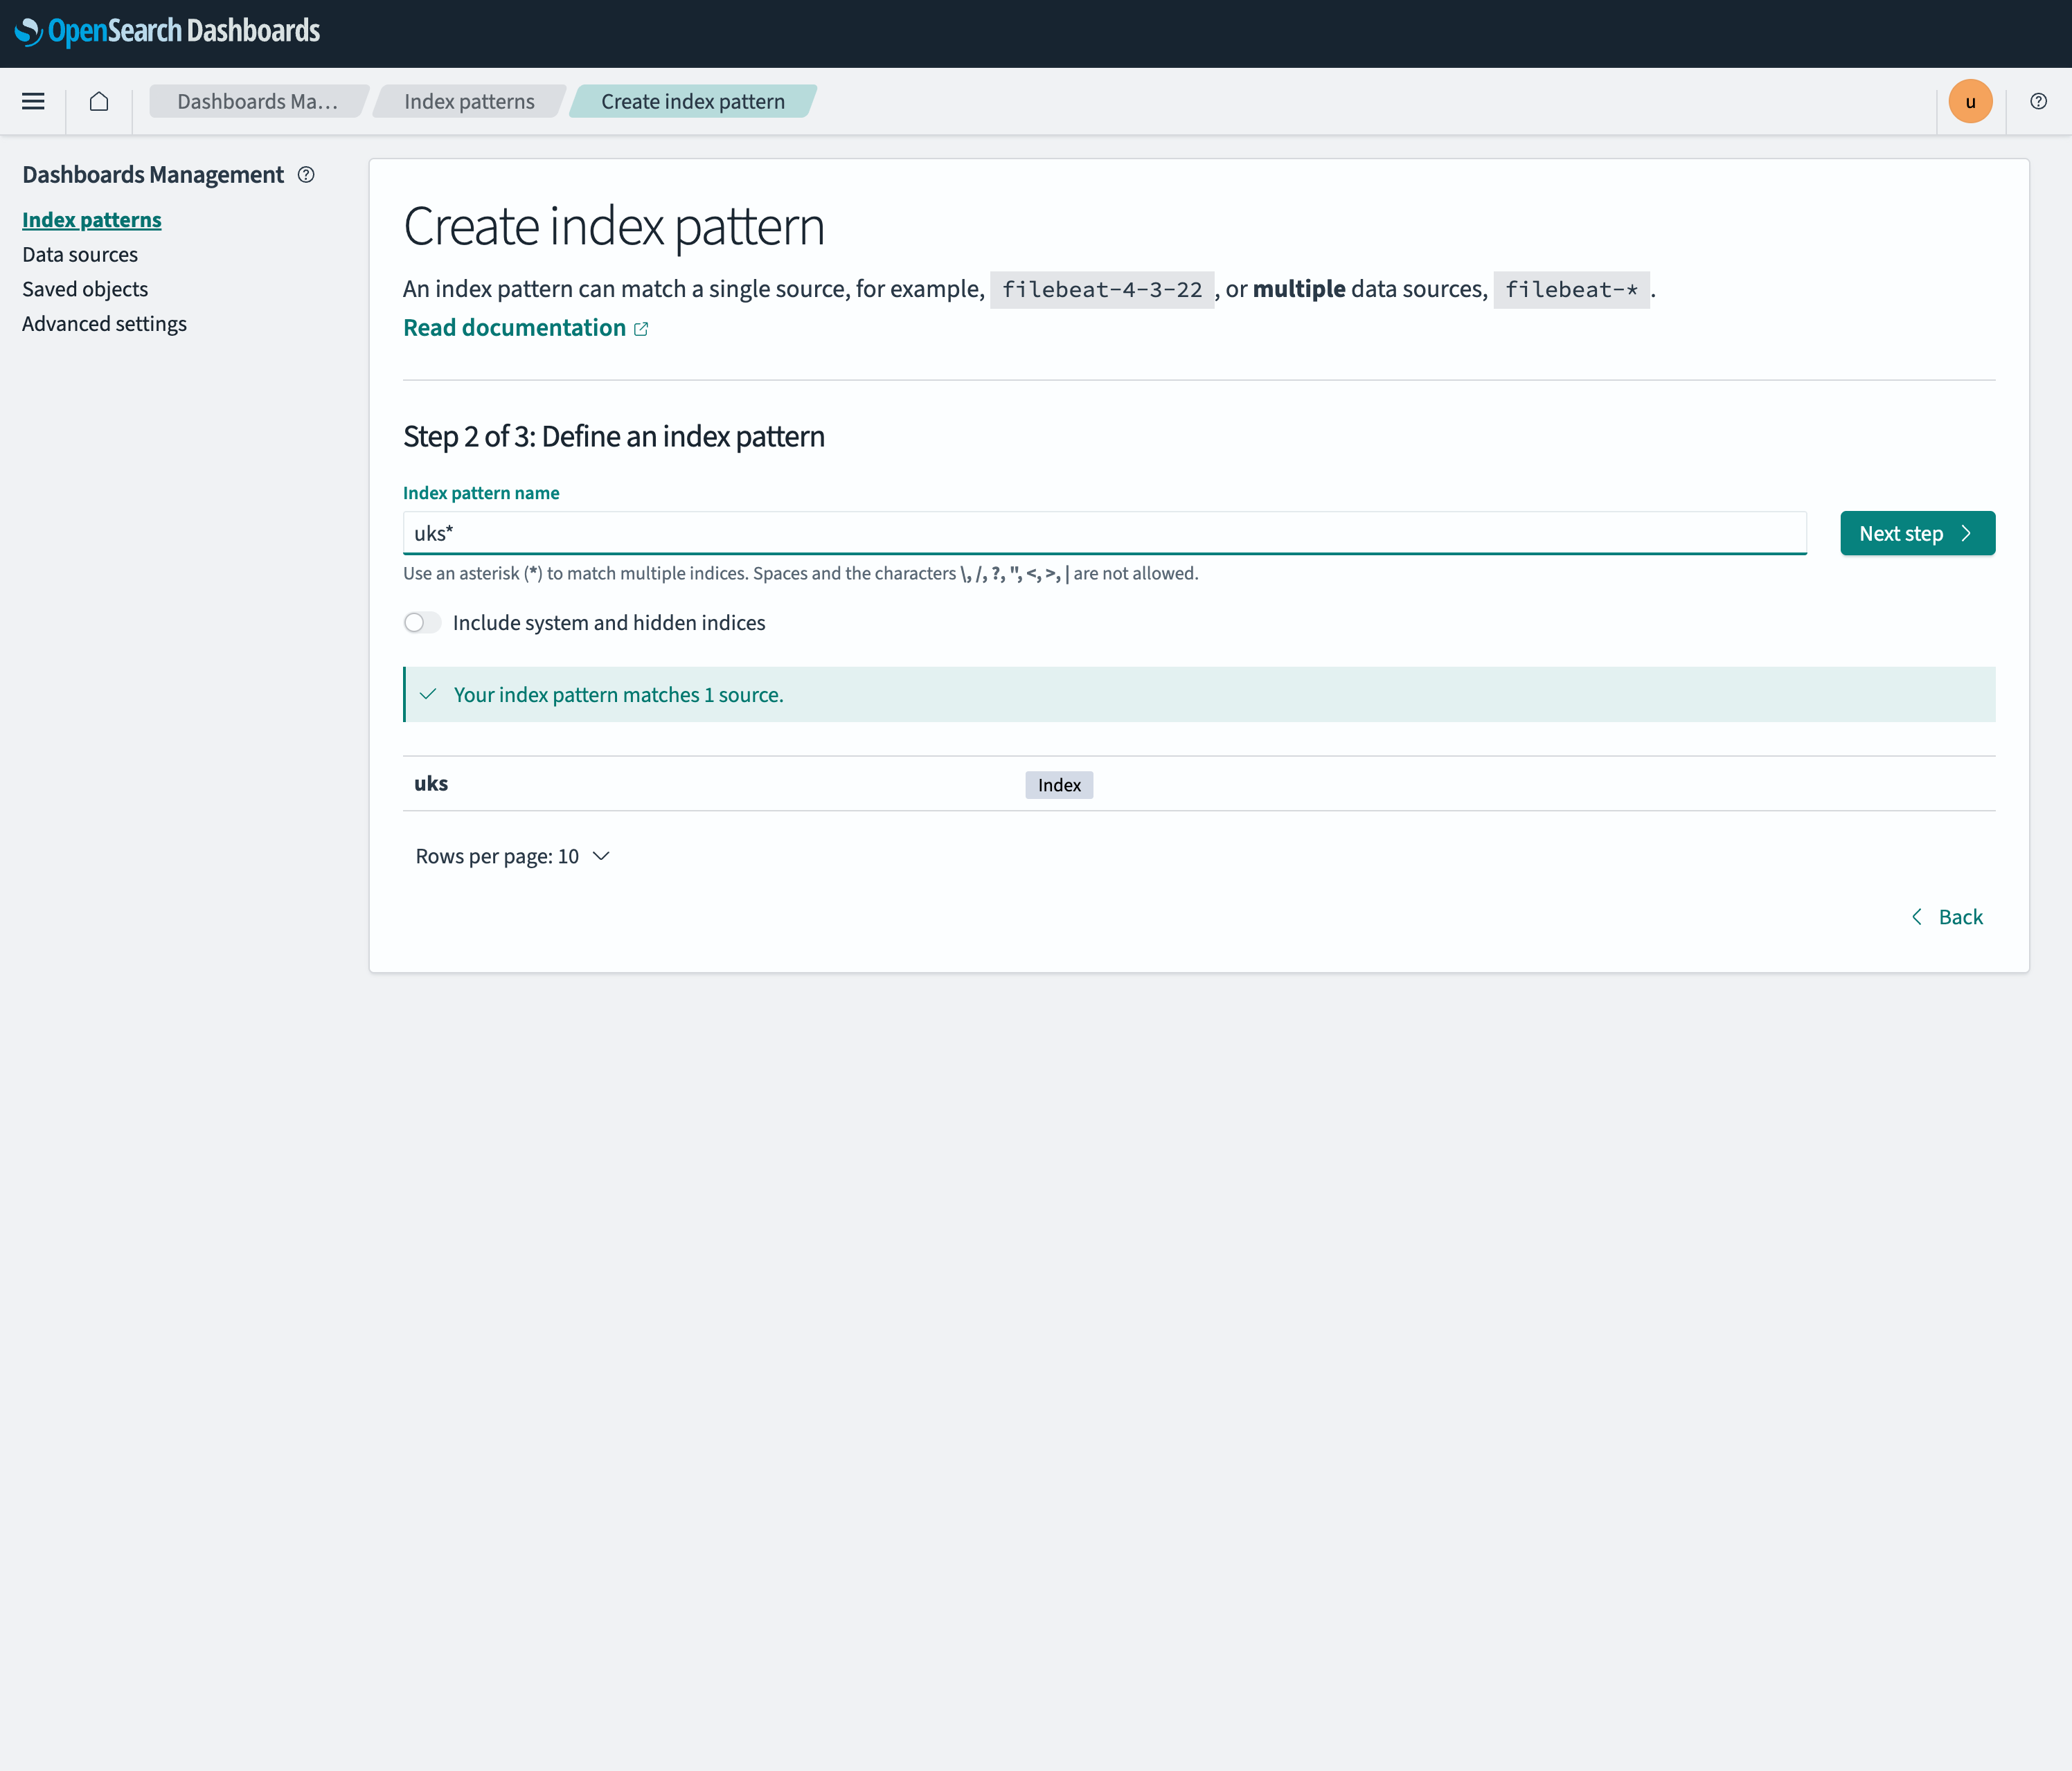
Step 3: in the Time field dropdown choose
@timestamp. Nothing is selected by default and the Create index pattern button stays disabled until you pick a value. Click Create index pattern.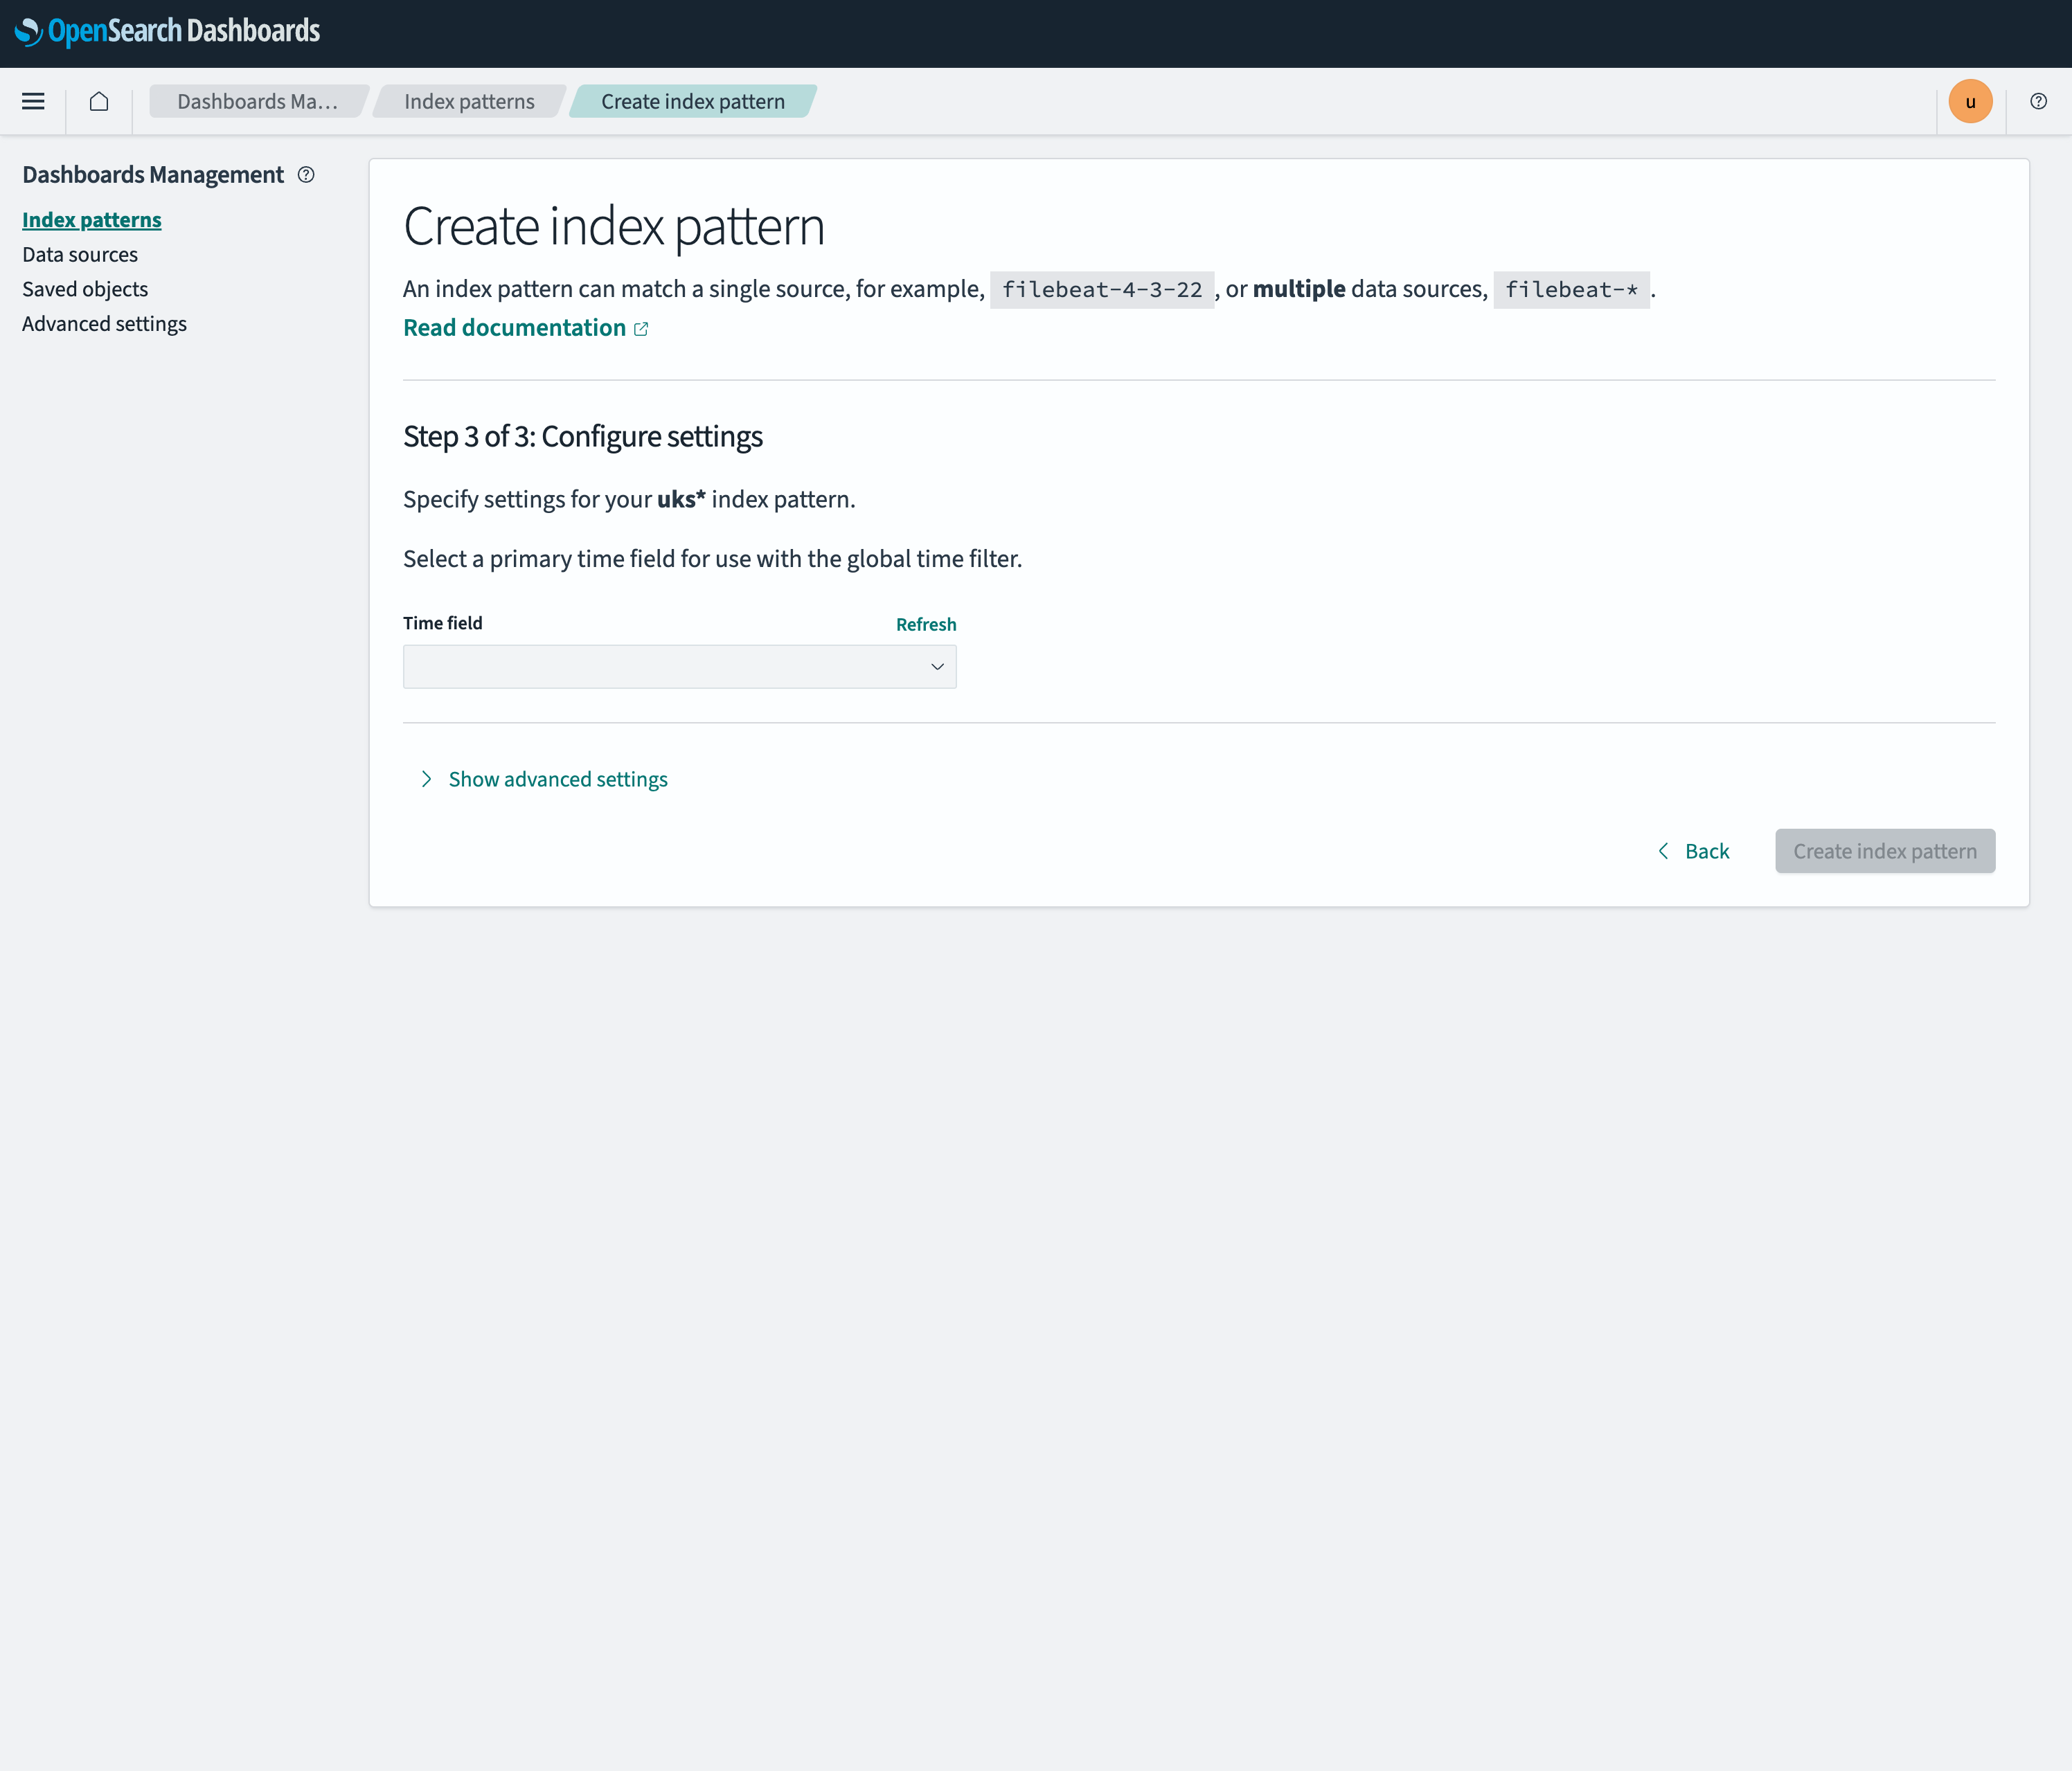
The wizard lands on the field list for
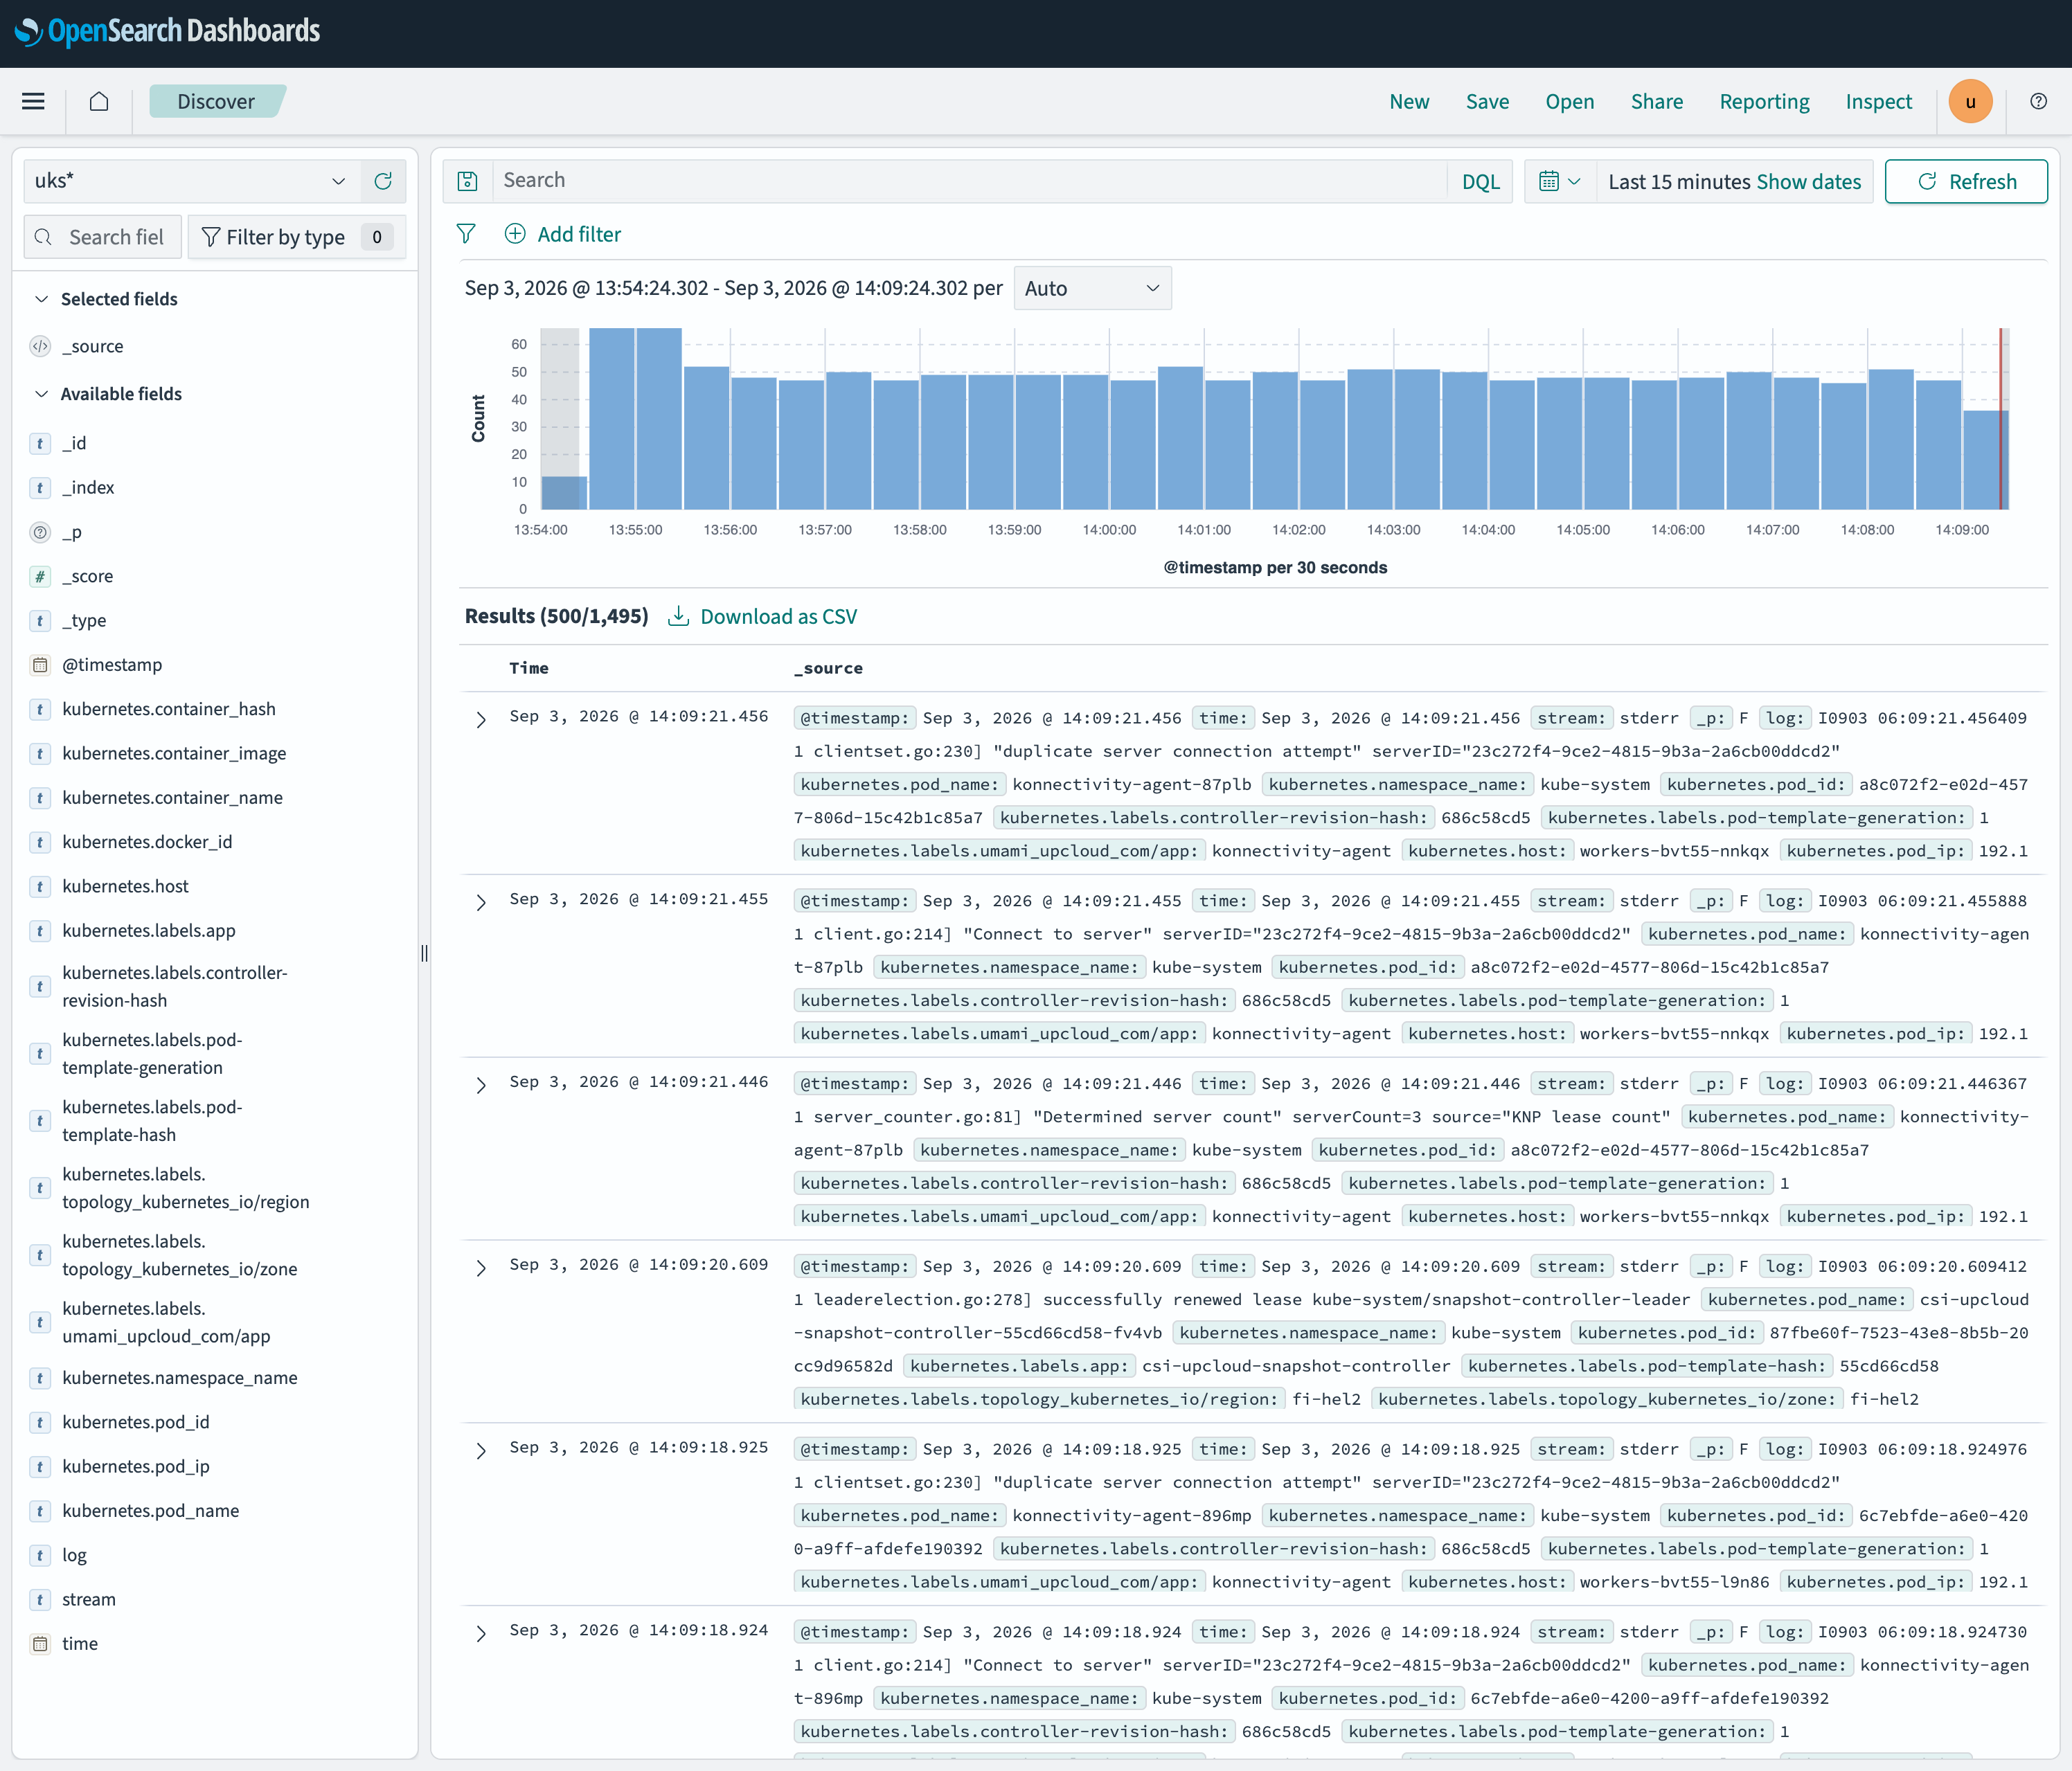
uks*. Open the menu and go to Discover. Theuks*pattern is selected automatically and the time range defaults to Last 15 minutes.
Container logs from the cluster now appear in Discover, with kubernetes.pod_name, kubernetes.namespace_name and kubernetes.container_name on every document.
Remove everything
To stop shipping logs, uninstall Fluent Bit:
helm uninstall fluent-bit --namespace fluent-bit
kubectl delete namespace fluent-bit
To delete the database and the fluentbit user, run this from the terraform directory:
terraform destroy -var-file=config.tfvarsAbout this guide