Welcome back to the four-part series on supercharging your CI/CD pipelines by deploying lightning-fast GitHub Actions Runners on UpCloud’s Managed Kubernetes! In Part 2, we looked at advanced configurations, including customizing runner deployments, implementing network policies for enhanced security, and setting up autoscaling to optimize costs.
In this installment, Part 3, we turn our attention to maintaining and troubleshooting your self-hosted runner environment. From monitoring runner health to diagnosing and resolving common issues like registration errors, resource constraints, and job execution failures, we will look at the tools and techniques needed to ensure smooth operations. Let’s dive right in!
Monitoring Runners
Monitoring self-hosted GitHub Actions runners is important to ensure the reliability, performance, and scalability of your CI/CD pipelines. By tracking a few key metrics, you can identify bottlenecks, optimize resource utilization, and promptly address issues before they impact your development workflow.
Luckily, GitHub Actions Runner ships with out-of-the-box support for key performance and usage metrics. In this section, you will learn how to enable them and which ones to track.
Exposing Metrics From Your GitHub Actions Runner Controller
To enable Prometheus to collect metrics from the Actions Runner Controller, first update the controller’s values file to enable the metrics:
metrics:
  controllerManagerAddr: ":8080"
  listenerAddr: ":8080"
  listenerEndpoint: "/metrics"
You will need to do a fresh install of the controller to apply these changes.
Next, you will also need to enable the default listener metrics in the scalesets you deploy in your cluster. To do that, create a values file for the scaleset and save the following contents in it:
listenerMetrics:
  counters:
    gha_started_jobs_total:
      labels:
        ["repository", "organization", "enterprise", "job_name", "event_name"]
    gha_completed_jobs_total:
      labels:
        [
          "repository",
          "organization",
          "enterprise",
          "job_name",
          "event_name",
          "job_result",
        ]
  gauges:
    gha_assigned_jobs:
      labels: ["name", "namespace", "repository", "organization", "enterprise"]
    gha_running_jobs:
      labels: ["name", "namespace", "repository", "organization", "enterprise"]
    gha_registered_runners:
      labels: ["name", "namespace", "repository", "organization", "enterprise"]
    gha_busy_runners:
      labels: ["name", "namespace", "repository", "organization", "enterprise"]
    gha_min_runners:
      labels: ["name", "namespace", "repository", "organization", "enterprise"]
    gha_max_runners:
      labels: ["name", "namespace", "repository", "organization", "enterprise"]
    gha_desired_runners:
      labels: ["name", "namespace", "repository", "organization", "enterprise"]
    gha_idle_runners:
      labels: ["name", "namespace", "repository", "organization", "enterprise"]
  histograms:
    gha_job_startup_duration_seconds:
      labels:
        ["repository", "organization", "enterprise", "job_name", "event_name"]
      buckets:
        [
          0.01,
          0.05,
          0.1,
          0.5,
          1.0,
          2.0,
          3.0,
          4.0,
          5.0,
          6.0,
          7.0,
          8.0,
          9.0,
          10.0,
          12.0,
          15.0,
          18.0,
          20.0,
          25.0,
          30.0,
          40.0,
          50.0,
          60.0,
          70.0,
          80.0,
          90.0,
          100.0,
          110.0,
          120.0,
          150.0,
          180.0,
          210.0,
          240.0,
          300.0,
          360.0,
          420.0,
          480.0,
          540.0,
          600.0,
          900.0,
          1200.0,
          1800.0,
          2400.0,
          3000.0,
          3600.0,
        ]
    gha_job_execution_duration_seconds:
      labels:
        [
          "repository",
          "organization",
          "enterprise",
          "job_name",
          "event_name",
          "job_result",
        ]
      buckets:
        [
          0.01,
          0.05,
          0.1,
          0.5,
          1.0,
          2.0,
          3.0,
          4.0,
          5.0,
          6.0,
          7.0,
          8.0,
          9.0,
          10.0,
          12.0,
          15.0,
          18.0,
          20.0,
          25.0,
          30.0,
          40.0,
          50.0,
          60.0,
          70.0,
          80.0,
          90.0,
          100.0,
          110.0,
          120.0,
          150.0,
          180.0,
          210.0,
          240.0,
          300.0,
          360.0,
          420.0,
          480.0,
          540.0,
          600.0,
          900.0,
          1200.0,
          1800.0,
          2400.0,
          3000.0,
          3600.0,
        ]

template:
    spec:
      containers:
      - name: runner
        image: ghcr.io/actions/actions-runner:latest
        command: ["/home/runner/run.sh"]
Now, you can verify that the metrics are being exposed by setting up a port forward and accessing them in your browser:
kubectl port-forward pod/<your-controller-pod-name> 8080:8080 -n arc-systemsYou can get your controller pod’s name by running kubectl get pods -n arc-systems and looking for a pod that has the word “controller” in its name:
➜  gh-actions-runner-p3 kubectl get pods -n arc-systems
NAME                                     READY   STATUS    RESTARTS   AGE
arc-gha-rs-controller-5d96468674-5hctf   1/1     Running   0          157m
arc-runner-set-754b578d-listener         1/1     Running   0          154m
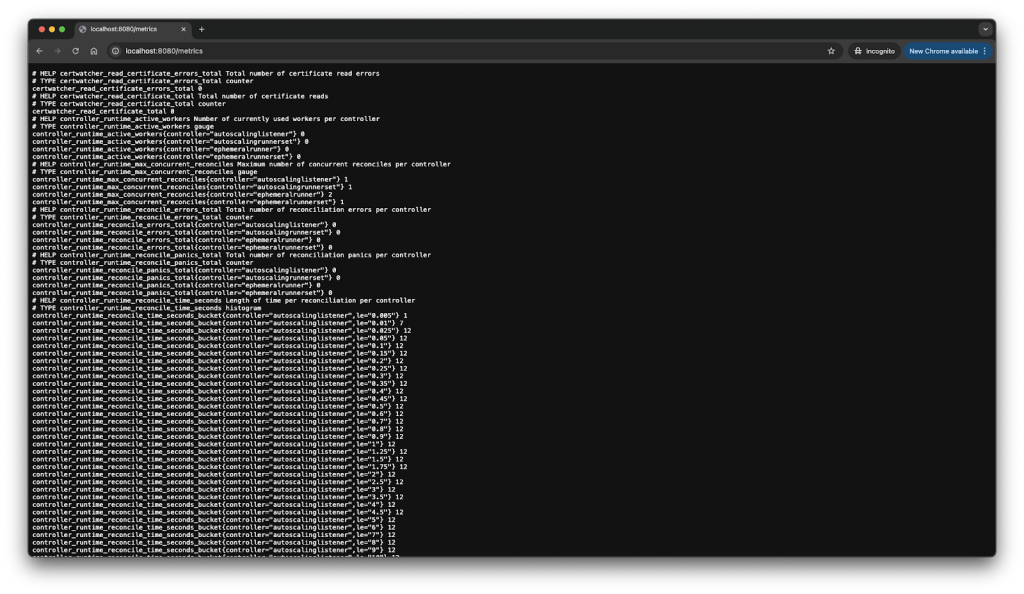
Once you have set up the port forwarding, try accessing the controller metrics now at http://localhost:8080/metrics. You should see something like this:
Similarly, you can try port-forwarding the listener pod and viewing the metrics that it exposes:
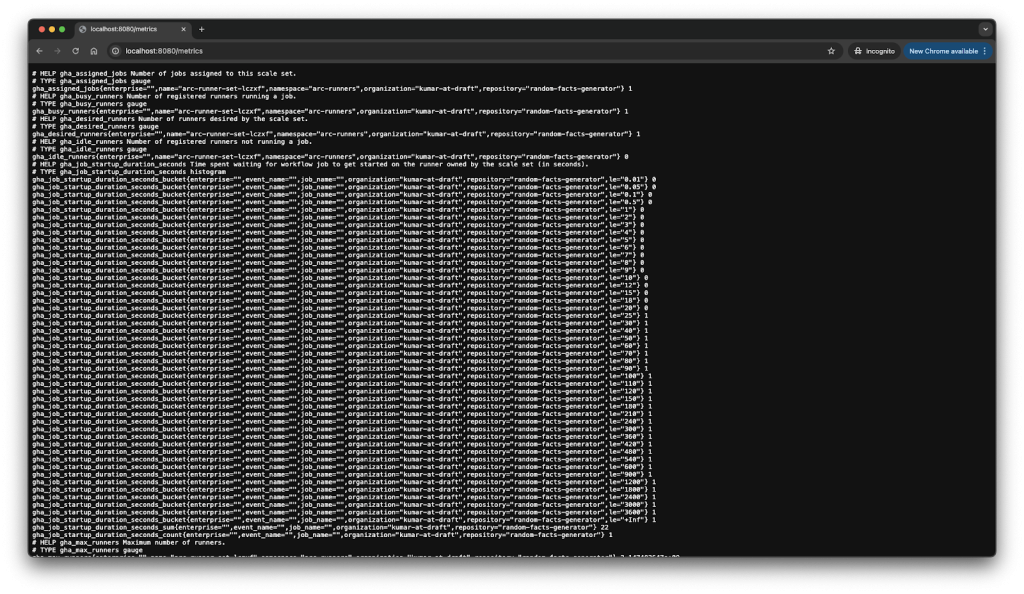
Understanding GitHub Actions Runner metrics
The configuration you have used above enabled and exposed all metrics supported by the Actions Runner Controller. The GitHub docs describe these metrics here.
If you were planning to build a performance monitoring dashboard, here are some metrics that would come in handy:
| Metric | Description | Purpose |
| gha_running_jobs | Number of jobs currently running or queued | Monitors workload and queue depth |
| gha_assigned_jobs | Number of jobs assigned to the runner scale set | Measures how many jobs were accepted for processing |
| gha_started_jobs_total | Cumulative number of jobs started | Tracks overall job volume |
| gha_completed_jobs_total | Cumulative number of jobs completed | Ensures all jobs complete successfully |
| gha_job_startup_duration_seconds | Time to start a job (histogram) | Highlights scheduling/startup latency |
| gha_job_execution_duration_seconds | Job execution time (histogram) | Helps monitor execution duration trends and outliers |
| gha_busy_runners | Number of runners currently executing a job | Shows how much capacity is being used |
| gha_idle_runners | Number of idle runners | Identifies underutilized capacity |
| gha_desired_runners | Target number of runners to scale to | Verifies if autoscaling is working correctly |
| gha_min_runners, gha_max_runners | Scale bounds set for the scale set | Helps correlate with autoscaling behaviors |
For a health monitoring dashboard, the following metrics would be useful:
| Metric | Description | Purpose |
| gha_controller_pending_ephemeral_runners | Number of runners stuck in pending state | Detects issues in provisioning runners |
| gha_controller_running_ephemeral_runners | Runners that are active | Baseline to compare expected runner load |
| gha_controller_failed_ephemeral_runners | Runners that failed to start | Alerts on provisioning or execution issues |
| gha_controller_running_listeners | Number of active listener pods | Verifies if listener components are healthy |
| gha_registered_runners | Runners registered with the scale set | Tracks overall runner availability |
Some other insights you can draw from these metrics include:
| Metric | Description | Purpose |
| Job Success Rate | gha_completed_jobs_total / gha_started_jobs_total | Helps monitor CI stability and test flakiness |
| Runner Utilization Rate | gha_busy_runners / gha_registered_runners | Determines scaling efficiency |
| Startup Latency Trends | Percentiles from gha_job_startup_duration_seconds | Identify if jobs are waiting too long to start (e.g., due to image pull or resource contention) |
| Execution Time Trends | Histogram from gha_job_execution_duration_seconds | Benchmark CI job complexity and highlight anomalies |
Also, all counter metrics (like gha_started_jobs_total) reset when the pod restarts. So you must ensure you’re using Prometheus with a persistent backend (like Thanos or Cortex) or reset-aware alerting. And you can also use histogram metrics (like durations) to create SLOs (e.g., “90% of jobs start within 10s”).
Understanding Runner Logs
Now that you have an active monitoring setup in place, it is time to look at the tools to use when you need to troubleshoot your controllers. Analyzing runner logs can come in quite handy for identifying and diagnosing issues in your self-hosted runners. Logs provide valuable insights into runner operations, errors, and warnings, allowing you to resolve problems quickly and maintain seamless CI/CD workflows.
Below are step-by-step instructions for accessing and interpreting runner logs within your Kubernetes environment:
Identify Your Runner Pods
First, identify the runner pods deployed by the Actions Runner Controller (ARC). Use the following command to list runner pods in your ARC namespace (typically arc-runners):
kubectl get pods -n arc-runnersThis command lists all runner pods along with their current status:
NAME                                           READY   STATUS    RESTARTS   AGE
runner-deployment-example-runner-abcde-12345   2/2     Running   0          3h
It is possible to receive an empty (“no resources found”) response for this command. This can happen if the runner has finished executing a job and has been terminated by the scaleset. In such situations, you might need to add a temporary sleep 3600 or similar step in your GitHub Actions workflow file and trigger the workflow again to make the runner pod stay alive for longer while you can try identifying it and accessing its logs.
Access Runner Logs Using kubectl
Once you have retrieved the name of the runner pod, run the following command to access its logs:
kubectl logs <runner-pod-name> -n arc-runnersAnalyze Runner Logs for Common Errors
Now, review the logs carefully, looking specifically for patterns like:
- Authentication errors (e.g., invalid tokens)
- Connectivity issues (e.g., inability to reach GitHub)
- Job execution failures (e.g., script errors, missing dependencies)
- Resource exhaustion messages (e.g., CPU or memory limits exceeded)
One important check you can do is to search for the “Job message”, which is an object sent by the remote GitHub Actions service with the details of the job which is currently executing on the runner. The presence of this object in the logs rules out any connectivity/authentication issues between the remote GitHub service and your runner scaleset. The details of this object can help you in determining missing/incorrect references or values mentioned in the workflow or one of the runner configuration files.
Filtering and Tail Logs
To continuously monitor logs or filter for specific messages, use:
kubectl logs <runner-pod-name> -n arc-runners --tail=50 -fThis command displays the latest 50 log entries and continues streaming new log entries in real time.
Saving Logs for Further Analysis
If you need to save logs for troubleshooting or reporting, redirect logs to a file:
kubectl logs <runner-pod-name> -n arc-runners > runner-logs.txtThis allows you to examine logs offline or share them with your team for collaborative debugging.
Debugging Runner Registration Issues
Runner registration issues can prevent your GitHub Actions self-hosted runners from joining your workflow, causing disruptions in your CI/CD pipeline. These problems often appear as runners stuck in a “Pending” state, authentication errors, or namespace conflicts.
Typical symptoms indicating runner registration issues include:
- Pods remain stuck in Pending or CrashLoopBackOff status.
- Log messages showing authentication failures or invalid tokens.
- Errors related to API access or namespace conflicts.
For example, you might encounter logs like this:
Runner registration failed: Authentication token expired or invalid.To fix this, you should start by verifying your GitHub Personal Access Token. Check that your GitHub Personal Access Token (PAT) used for runner registration is valid and has the necessary permissions:
- Go to your GitHub repository or organization: Settings → Actions → Runners
- Confirm your token is still valid and hasn’t expired or been revoked.
- Confirm your token is still valid and hasn’t expired or been revoked.
If necessary, generate a new token and update your ARC secret accordingly.
Next, check namespace usage and permissions. You need to ensure the namespace you’re using for the Actions Runner Controller (ARC) is dedicated exclusively to ARC deployments.
Run the following command to list the deployments and pods in your ARC namespaces (arc-systems and arc-runners) and ensure that no non-ARC resources are deployed here:
kubectl get deployments,pods -n <your-arc-namespace>Also, validate that the roles and rolebindings created in these namespaces are accurate and allow the controller to register runners. By default, permissions are correctly configured when installing ARC via Helm. Manual changes can sometimes cause permission-related errors.
Finally, if nothing works, you can directly debug at the pod level by executing commands within the runner pod:
kubectl exec -it <runner-pod-name> -n <your-arc-namespace> -- /bin/bashOnce inside, you can try performing additional checks, such as verifying connectivity to GitHub or inspecting the runner configuration directly.
Scale Set Controller Troubleshooting
The Scale Set Controller in Actions Runner Controller (ARC) is responsible for managing the number of runner pods based on job demand. When something goes wrong, you might notice symptoms like:
- Runner pods not scaling up when jobs are queued.
- Pods being created but failing to start.
- Stale or idle pods not terminating as expected.
These issues often stem from misconfigurations or resource constraints. Here’s how to troubleshoot them effectively.
Check the Scale Set Controller Pod
First, ensure that the scale set controller pod is healthy:
kubectl get pods -n arc-systemsLook for a pod named something like actions-runner-controller-xxxxx. If it’s in a CrashLoopBackOff or Error state, inspect its logs:
kubectl logs <controller-pod-name> -n arc-systemsCommon causes could include:
- Invalid or missing GitHub credentials
- GitHub API rate limiting
- Misconfigured Helm values (e.g., missing enterprise, organization, or repository fields)
Watch Runner Pods in Real Time
Another way to approach this could be to look at runner scaling activity in real time while triggering a workflow. To do that, run the following command:
kubectl get runners -n arc-runners -wThis helps you confirm whether runners are being created in response to incoming jobs and whether they’re terminating after execution.
Check Helm Values for Scaling Parameters
If no runners are spinning up, revisit your Helm config:
- Is
minRunnersset to 0 or too low? - Is
maxRunnershigh enough to meet demand? - Are GitHub org/repo/labels correctly configured?
Updating your Helm release with correct values may resolve silent scaling issues.
Look for Cluster Resource Issues
Finally, make sure your cluster has capacity. Even if ARC wants to schedule pods, they’ll stay in Pending if nodes are out of resources:
kubectl describe pod <runner-pod-name> -n arc-runnersLook for “Insufficient memory” or “Insufficient cpu” messages.
Addressing Resource Issues
Even when your GitHub Actions runners are correctly configured, they may fail to start or behave unpredictably due to resource constraints in your Kubernetes cluster. These issues can surface as pods stuck in Pending, runners terminating prematurely, or jobs taking longer than expected.
Identify Resource Constraints
To find out if a runner pod failed due to lack of resources, describe the pod:
kubectl describe pod <runner-pod-name> -n arc-runnersLook for messages like:
0/3 nodes are available: insufficient memory.This indicates the cluster doesn’t have enough available CPU or memory to schedule new runner pods.
Review and Adjust Resource Requests
As you’ve seen in the last part, you can define resource requests and limits for your runners in the scaleset’s values file. If your runners frequently hit memory or CPU limits, consider increasing these values. Conversely, if jobs are lightweight and overprovisioned, reducing the resource requests can improve overall cluster utilization.
Scale the Cluster or Add Node Pools
If your runners are correctly configured but still can’t schedule due to capacity, you may need to add more nodes to your cluster or set up auto-scaling for your node pools.
Handling Job Execution Failures
Job execution failures can occur even when runners are healthy and scaling properly. These failures typically arise from issues within the GitHub Actions workflows themselves or from environment-related problems inside the runner pod.
Check Workflow Logs in GitHub
Start by reviewing the job logs directly in the GitHub Actions UI. Common causes of failure include:
- Syntax errors in the workflow YAML
- Missing or incorrect secrets
- Broken shell scripts or failing test commands
These errors will be visible in the step-by-step job output.
Inspect Runner Pod Logs
If the failure seems environment-related, inspect the runner pod logs:
kubectl logs <runner-pod-name> -n arc-runnersLook for errors like missing binaries, filesystem write errors, or permission issues.
Some general tips to reduce such failures include:
- Use retry logic in workflows (workflow-level
continue-on-errorormax-attemptsconfiguration) - Add timeouts to prevent stuck jobs
- Validate workflows with act locally before pushing
Useful Commands and Quick Reference
Here’s a handy collection of commands to help you troubleshoot, monitor, and manage your GitHub Actions runners on UpCloud’s Managed Kubernetes:
- View ARC pods and their status:
kubectl get pods -n arc-systems - Watch runner pods in real time:
kubectl get pods -n arc-runners -w - Describe a runner pod to debug issues:
kubectl describe pod <runner-pod-name> -n arc-runners - View logs for a runner pod:
kubectl logs <runner-pod-name> -n arc-runners - Exec into a runner pod shell:
kubectl exec -it <runner-pod-name> -n arc-runners -- /bin/bash - Restart the ARC deployment:
kubectl rollout restart deployment actions-runner-controller -n arc-systems
Conclusion
In this third part of the series, we focused on keeping your GitHub Actions runners healthy, observable, and resilient. You learned how to monitor runners with Prometheus and Grafana, how to inspect logs and debug registration issues, and how to troubleshoot common problems with scaling, resources, and job execution. With these tools and techniques, you should now feel confident about detecting issues early and ensuring the smooth operation of your self-hosted CI/CD pipelines.
But deploying fast and reliable runners is only part of the story. In Part 4, we’ll shift our attention to security best practices—covering everything from managing secrets securely and implementing RBAC to setting up audit-friendly logging and update strategies that keep your pipeline compliant and protected.
Continue on with the part 4 to harden your GitHub Actions runners with best security practices.
Discussion