Editors note: Since publishing, ServerBear has been shut down. The performance metrics are still fairly valid but more recent benchmarks can be found here and here. You can also compare us against other providers, such as AWS EC2, DigitalOcean and Vultr.
Performance is an interesting feature in a hosting provider – if two cloud servers are priced the same but the other performs 2x faster, do they really cost the same? If this caught your attention, keep on reading for the benchmarks.
At UpCloud, we believe that the amount of computing or performance the customer gets for their money is fundamental in cloud computing – not just the amount of resources on paper. Indeed, great performance is one of our main values and we decided to run some performance benchmarks to validate this.
We are using ServerBear (EDIT 2017-01-13: service discontinued since publishing) for transparency, as the scores are public. We selected instances that can at least match 4 CPU cores, 8GB of RAM and for storage, we picked the fastest SSD available from each provider. For UpCloud, this means our MaxIOPS storage that is now in public beta. The following table summarises the chosen instances and their approximate monthly costs:
| Selected Configurations | |||||
|---|---|---|---|---|---|
| Company | UpCloud | DigitalOcean | Azure | AWS EC2 | |
| Instance | 4 CPU, 8GB RAM | $ 80 / mo (4 CPU, 8GB Memory) | n1-standard-4 (4 CPU, 15 GB memory) | D4 (4CPU, 15GB RAM) | c3.xlarge (4CPU, 7.5GB RAM) |
| Storage | MaxIOPS (100 GB) | SSD (80GB) | Persistent SSD 500GB | D4 SSD 250GB | EBS Provisioned IOPS (134GB) |
| AZ | London | Amsterdam | europe-west1-a | N Europe | Ireland |
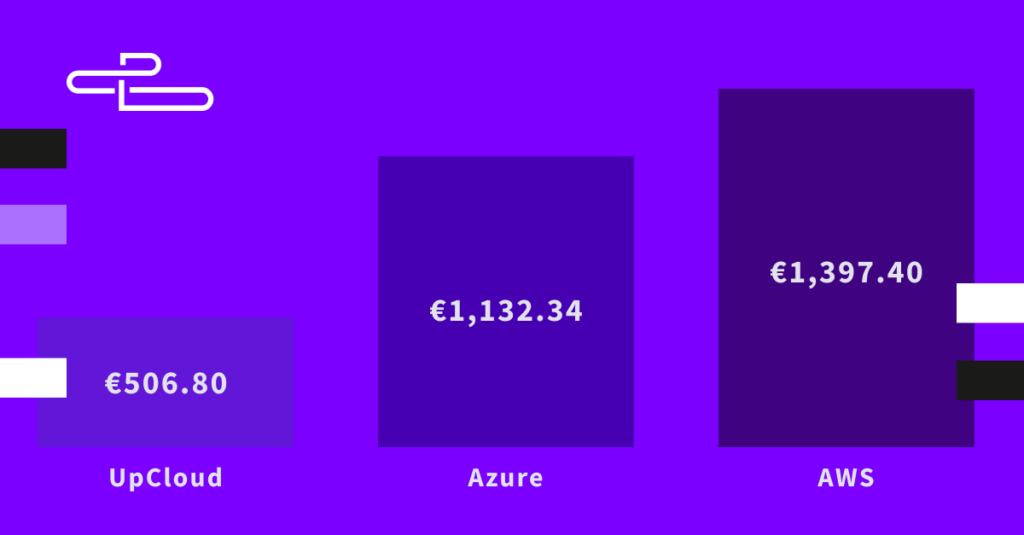
| Price per month | 63.00 € | 63.00 € | 228.00 € | 379.00 € | 377.00 € |
| Azure and DigitalOcean set the SSD size and they are not changeable by the user. AWS bills $0.072 per IOPS and $0.138 per GB and there must be 30:1 IOPS-GB AWS 7.5GB is close enough to 8GB for the sake of this test. Google requires at least 500GB for maximum IOPS performance UpCloud MaxIOPS has equal performance with any disk size, we picked 100GB | |||||
CPU Performance
| UnixBench Multi-CPU | |
|---|---|
| Company | Score |
| UpCloud | 2905.1 |
| DigitalOcean | 1561.1 |
| 3084 | |
| Azure | 3211.3 |
| AWS | 3267.5 |
First on is the CPU performance. ServerBear uses UnixBench, which is an extensive CPU benchmark. The scores shown are for multi-CPU (4 cores) performance.
According to UnixBench – UpCloud, AWS, Google and Azure are all comparably fast. However, it is important to note here that the Google n1-standard-4 instance has almost twice the RAM compared to UpCloud, the AWS instance is a high-end compute optimised instance and the Azure D4 is part of their new, high-end product line. All of these three have many times the cost of UpCloud’s chosen configuration. DigitalOcean, on the other hand, is clearly behind the others and in the same price range as UpCloud.
IO Performance
The second comparison is of IO performance. We are comparing the FIO benchmark by ServerBear (we had to customise their script a bit for Google and Azure, please see the appendix) as we believe that FIO gives a more realistic understanding of performance in real life use than dd or ioping. You may, however, see the results of these two by following the links to ServerBear’s results pages for each benchmark – again, please see the appendix.

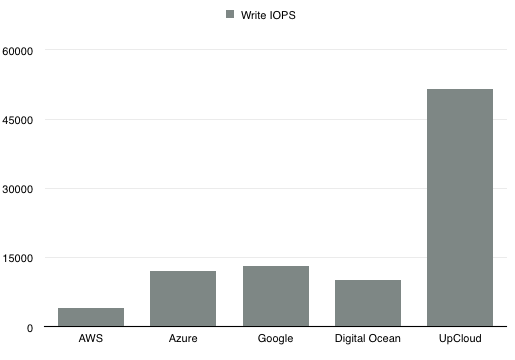
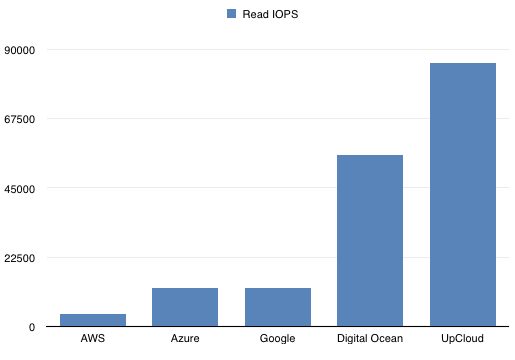
UpCloud’s MaxIOPS shows superb performance with read IOPS close to 80 000 and write IOPS close to 50 000. Please note that we are running all of the tests on production systems – you can go test our MaxIOPS right now with our free trial.

To give a better idea of how fast MaxIOPS actually is – take a look at the table below. UpCloud is up to 19x faster than Amazon Web Services with provisioned IOPS that costs eight times as much. If you want the specific figures where these are based on, please have a look at the appendix.
| How Much Faster is UpCloud? | ||||
|---|---|---|---|---|
| Company | Read IOPS | Read Bandwidth | Write IOPS | Write Bandwidth |
| AWS EC2 | 19x | 19x | 12.6x | 12.6x |
| Azure | 6x | 6x | 4x | 4x |
| 6x | 6x | 3.9x | 3.9x | |
| DigitalOcean | 1.4x | 1.4x | 5x | 5x |
Conclusion
While performance benchmarks are not the whole story, we believe these numbers speak for themselves. If you want great performance with competitive pricing go ahead and try UpCloud. There really isn’t a reason not to use MaxIOPS when it is priced at only 0.20€ per GB a month.
Appendix
| FIO | |||||
|---|---|---|---|---|---|
| Company | AWS | Azure | DigitalOcean | UpCloud | |
| Read IOPS | 4111 | 12381 | 12356 | 55564 | 85576 |
| Read MB/s | 16.4 | 49.5 | 49.4 | 222.2 | 342.3 |
| Write IOPS | 4101 | 12078 | 13246 | 10236 | 51463 |
| Write MB/s | 16.4 | 48.3 | 52.9 | 40.9 | 205.8 |
| ServerBear | |
|---|---|
| Link to Benchmark | Notes |
| UpCloud | All scores directly from ServerBear |
| Azure | Custom FIO config to test /dev/sdb1 for realistic results |
| DigitalOcean | All scores directly from ServerBear |
| AWS | All scores directly from ServerBear |
| Custom FIO config to test /dev/sdb1 for realistic results | |

