What is OpenTelemetry? Understanding the Standard for Cloud-Native Observability
-
About
- Type
- Blog
- Category
- Cloud Infrastructure
About
Posted on 19 October 2025
Modern cloud-native applications rarely run as a single process anymore. They’re composed of microservices, containers, APIs, and managed cloud resources working together in complex, distributed environments. When something breaks, logs alone aren’t enough to reveal why. Teams need a way to see what’s happening across every component, in real time, without guesswork.
That’s the role of observability. It provides the insight necessary to understand system health, performance, and behavior as your application evolves. But achieving true observability isn’t simple. Data comes in many forms: metrics, traces, and logs. Each service might use different frameworks or formats. Without a consistent way to collect and correlate this telemetry, visibility gaps and blind spots quickly emerge.
OpenTelemetry was created to solve exactly this problem. It standardizes how telemetry data is generated, processed, and exported, regardless of language, platform, or vendor, so that developers can focus on understanding their systems, not wiring up their monitoring tools.
In this guide, you’ll explore what OpenTelemetry is, how it works, and why it’s become the de facto standard for observability in the cloud-native world. Then, you’ll move from theory to practice by setting up an OpenTelemetry pipeline on UpCloud Managed Kubernetes; complete with real instrumentation, collection, and visualization.
At the heart of observability is telemetry: the data your systems emit as they run. Every request, process, and background task produces signals that reveal how the system behaves under load, how dependencies interact, and where performance bottlenecks occur.
OpenTelemetry organizes this information into three primary signal types: metrics, traces, and logs:
When these three signals are correlated, they offer a 360° view of your system’s health. Metrics show the symptoms, traces pinpoint where the problem occurred, and logs explain what was happening at that moment. OpenTelemetry unifies these data types so teams can collect, analyze, and act on them consistently, without maintaining separate agents or instrumentation for each tool.
OpenTelemetry (often shortened to OTel) is an open-source, vendor-neutral observability framework that defines a consistent way to collect, process, and export telemetry data (metrics, traces, and logs that you saw above) from applications and infrastructure. It was created through the merger of two earlier projects, OpenTracing and OpenCensus, and is now a Cloud Native Computing Foundation (CNCF) project.
At its core, OpenTelemetry provides:
Instead of maintaining different agents for metrics, logs, and tracing, or rewriting instrumentation for each monitoring platform, OpenTelemetry gives you a single, unified standard. It lets developers instrument code once and send data anywhere, whether that’s Prometheus, Grafana Cloud, Datadog, or another backend.
This approach improves interoperability. By adopting OpenTelemetry, teams can standardize their observability stack, future-proof their data pipelines, and avoid the vendor lock-in that often comes with proprietary monitoring agents.
As modern applications span multiple environments, tools, and languages, observability can easily become fragmented. OpenTelemetry’s biggest advantage is that it brings consistency and portability to this chaos. By standardizing how telemetry data is produced and shared, it gives teams a unified foundation for monitoring and analysis.
Here are some of its key benefits:
Extensible and Future-Proof: OpenTelemetry’s modular architecture makes it easy to add new receivers, processors, or exporters as your stack evolves. You’re not tied to any one vendor’s roadmap. Your telemetry remains yours to control, extend, and scale.
While OpenTelemetry has quickly become the de facto standard for observability, it’s not the only way to collect telemetry data. Before thinking about adopting it, it’s worth understanding how it compares to other popular monitoring and tracing tools.
Traditional APM (Application Performance Monitoring) tools like Datadog, New Relic, and Dynatrace often rely on proprietary agents for data collection. These agents are easy to set up and deeply integrated into the vendor’s platform, but they can introduce vendor lock-in as your telemetry is tightly coupled to that ecosystem.
By contrast, OpenTelemetry offers flexibility and portability. You can use the same instrumentation to send data to any backend, switch vendors without touching your code, or even export data to multiple tools at the same time.
Prometheus focuses primarily on metrics collection and alerting. It’s excellent for time-series data and Kubernetes monitoring, but it doesn’t natively handle traces or logs.
OpenTelemetry complements Prometheus rather than replacing it. You can use OTel to collect and enrich telemetry, then export metrics to Prometheus for long-term storage and querying.
Tools like Jaeger and Zipkin specialize in distributed tracing, helping visualize request flows across services. However, they typically rely on proprietary SDKs or limited language support.
OpenTelemetry standardizes tracing APIs across all major languages and can export data to Jaeger or Zipkin, combining the best of both worlds: standardized instrumentation with your preferred visualization backend.
You should choose OpenTelemetry if you:
Proprietary tools might win on convenience for small teams or single-vendor setups, but OpenTelemetry wins on flexibility, scalability, and control, making it the better long-term choice for cloud-native observability.
OpenTelemetry simplifies observability by defining a standard pipeline for telemetry data, from generation inside your applications to export into your preferred backend. Whether you’re collecting logs from a containerized service or traces from a multi-tier web app, the flow remains consistent.
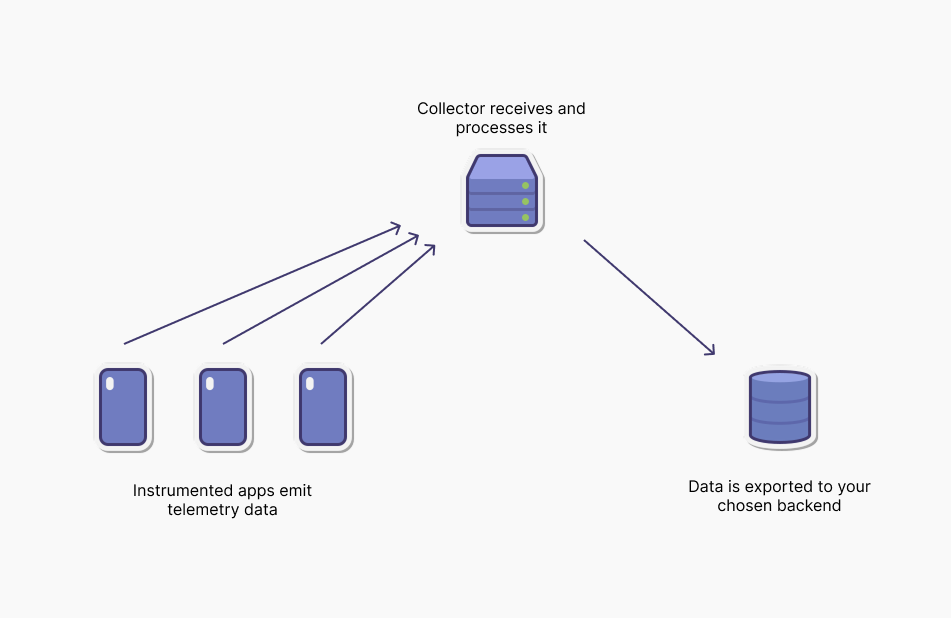
How data flows in an OpenTelemetry setup
At a high level, OpenTelemetry works through three main components:
Instrumentation is the process of adding OpenTelemetry hooks into your code or services to generate telemetry data. This can be done in two ways:
This flexibility ensures you can start small, with auto-instrumentation for quick setup, and later fine-tune your telemetry for more detailed insights.
The Collector is a standalone service that acts as a bridge between your applications and your observability backend. It receives telemetry data from instrumented applications, processes it (filtering, enriching, or batching), and exports it to one or more destinations.
Because the Collector is vendor-agnostic, it decouples data generation from data storage, allowing you to switch or combine monitoring tools freely. It can run as an agent (sidecar) or as a centralized service in your Kubernetes cluster.
The OpenTelemetry Protocol (OTLP) standardizes how telemetry data is transmitted between systems. It supports both HTTP and gRPC for high-performance data transport. By using a common protocol, OpenTelemetry ensures interoperability across languages, libraries, and observability tools.
Modern observability doesn’t stop at local development. It must scale seamlessly across clusters, nodes, and regions. That’s where OpenTelemetry truly shines. Its architecture fits naturally into cloud-native environments built on platforms like Kubernetes, Docker, and serverless functions, where workloads are ephemeral and constantly shifting.
In these environments, the OpenTelemetry Collector acts as the observability backbone. Deployed as a Kubernetes Deployment or DaemonSet, it automatically discovers application workloads, aggregates their telemetry, and enriches it with contextual metadata such as pod names, namespaces, or node labels. This makes troubleshooting distributed systems far easier. You can correlate slow requests, pod restarts, and infrastructure metrics under one consistent view.Because the Collector is vendor-agnostic, it’s also ideal for multi-cloud and hybrid setups. You can collect telemetry from workloads running on different cloud providers, process it centrally, and export it to any backend or multiple destinations simultaneously. This flexibility makes OpenTelemetry a perfect companion for Managed Kubernetes services like UpCloud Managed Kubernetes, where teams want to combine operational simplicity with full control over observability data.
By now, you clearly understand what OpenTelemetry is and why it has become the backbone of cloud-native observability. You’ve seen how it unifies metrics, traces, and logs under a single open standard, how the Collector serves as a central processing hub, and how it integrates seamlessly with containerized, distributed systems.
Suppose you’re ready to put this into practice. In that case, we’ve published a separate hands-on tutorial that walks you through setting up a full OpenTelemetry pipeline on UpCloud Managed Kubernetes, from cluster provisioning to data visualization.
👉 Read next: How to Deploy OpenTelemetry on UpCloud Managed Kubernetes
That guide covers: