In any new-age cloud setup, centralized monitoring is essential for gaining visibility across distributed systems if you intend to improve performance and respond to incidents quickly. Whether you’re deploying workloads in containers or directly on virtual machines, a unified view of your infrastructure is a non-negotiable when it comes to maintaining reliability. That’s where Prometheus, a widely adopted open-source tool for metrics collection and alerting, comes in. Known for its powerful query language, flexible integrations, and active ecosystem, Prometheus has grown to become the standard for observability in Kubernetes environments.
This series will walk you through setting up centralized monitoring using Prometheus on UpCloud’s Managed Kubernetes. The combination is particularly powerful for teams running hybrid environments, where containerized workloads coexist with traditional VM-based services.
In this first part of the series, you’ll learn how to provision a dedicated monitoring cluster, install Prometheus using the kube-prometheus-stack, secure your setup, and extend monitoring to include external VMs. By the end, you’ll have a production-ready monitoring setup that can scale across your entire UpCloud infrastructure.
Prerequisites
To follow along with this series, you will need the following:
kubectlinstalled locally for interacting with your Kubernetes cluster.helminstalled locally for installing the Prometheus stack.- An UpCloud account. You can create one here if needed.
upctlinstalled locally for managing UpCloud resources from your CLI.
You will also need a Kubernetes cluster to set up the Prometheus stack on, but you’ll see step-by-step instructions below on how to set it up on UpCloud.
Provisioning a Dedicated Monitoring Cluster on UpCloud
To get started with centralized monitoring, the first step is to provision a dedicated UpCloud Managed Kubernetes cluster that will run your Prometheus stack. Hosting your monitoring tools in a separate cluster makes sure that observability workloads remain separate from application workloads, preventing noisy neighbor issues and simplifying resource planning.
You can create a cluster either through the UpCloud Control Panel or using the upctl CLI tool. For production-grade monitoring, consider a cluster with at least three nodes to ensure high availability. Each node should have a minimum of 4 vCPUs and 8GB of RAM to handle the load from Prometheus’s time-series data, Alertmanager, and optional components like Grafana or exporters.
Before you can create a new Kubernetes cluster in UpCloud, you will need to create a private network for it. The network needs to have DHCP enabled, so you can use the following command to create it:
upctl network create --name "monitoring-net" --zone de-fra1 --ip-network address=10.0.1.0/24,dhcp=trueNow, here’s the command you need to run to provision the cluster:
upctl k8s create \
  --name monitoring-cluster \
  --network monitoring-net \
  --zone de-fra1 \
  --plan "production-small" \
  --version 1.30 \
  --node-group name=monitoring-nodes,count=3,plan=4xCPU-8GB
This command provisions a three-node cluster in Frankfurt, with each node sized for moderate workloads. If you expect to scrape metrics from many Kubernetes services or external VMs, you may want to choose a larger plan (e.g., 6xCPU-16GB) to accommodate Prometheus’s memory-intensive operations.
Once the cluster is ready, download its kubeconfig to your local machine:
upctl k8s config monitoring-cluster --output yaml --write ~/.kube/configWith your monitoring cluster provisioned and configured, you’re ready to install Prometheus using the kube-prometheus-stack Helm chart in the next section.
Installing Prometheus with kube-prometheus-stack
The simplest way to deploy Prometheus on Kubernetes is by using the kube-prometheus-stack Helm chart. Maintained by the Prometheus Community, this chart bootstraps a full monitoring setup that includes Prometheus, Alertmanager, node exporters, and a set of preconfigured rules and dashboards. It’s the recommended starting point for production monitoring environments.
Step 1: Add the Helm Repository
If you haven’t already, add the Prometheus Community Helm repository:
helm repo add prometheus-community https://prometheus-community.github.io/helm-charts
helm repo update
Step 2: Create a Minimal values.yaml Configuration
Before installation, prepare a values.yaml file to customize the deployment. Here’s a minimal example:
prometheus:
  prometheusSpec:
    serviceMonitorSelectorNilUsesHelmValues: false
    ruleSelectorNilUsesHelmValues: false


alertmanager:
  enabled: true


grafana:
  enabled: false  # You can enable this later if you want built-in dashboards
This configuration ensures that Prometheus will respect custom service monitors and alerting rules you add in the future, while keeping the setup minimal to start.
Step 3: Install the Chart
Now deploy the chart into a dedicated namespace (e.g., monitoring):
kubectl create namespace monitoring


helm install prometheus-stack prometheus-community/kube-prometheus-stack \
  --namespace monitoring \
  -f values.yaml
Helm will deploy all components and set up the necessary service accounts, role bindings, and default alerting rules. You can monitor the progress of the installation with:
kubectl get pods -n monitoring -wOnce all pods are running, you’ll have a working Prometheus setup collecting metrics from the cluster, ready to be extended for more advanced use cases like VM monitoring!
Next, we’ll secure this setup by configuring access controls and firewall rules.
Securing the Monitoring Setup
Once Prometheus is deployed, it’s important to secure access to your monitoring infrastructure, both at the network and cluster levels. This helps prevent unauthorized access to sensitive metrics, ensures Prometheus is scraping only intended targets, and keeps your monitoring environment compliant with best practices.
Enable Role-Based Access Control (RBAC)
The kube-prometheus-stack Helm chart automatically sets up service accounts and roles, but it’s good practice to review them to ensure least privilege is enforced. For example, Prometheus should have permission to read metrics and service discovery data, but not to modify Kubernetes objects.
You can inspect the bindings with:
kubectl get clusterrolebinding -n monitoringIf you need to restrict access further, you should consider creating custom ClusterRole and ClusterRoleBinding resources scoped to Prometheus’s namespace and service account.
Service Account Security
You should also verify that each Prometheus component (Prometheus server, Alertmanager, exporters) runs with the correct service account and minimal privileges. This can help contain damage in case of a container escape or misconfiguration.
kubectl get serviceaccount -n monitoringYou can use Kubernetes’ built-in audit tools or integrations like OPA Gatekeeper for enforcing policy compliance.
With your monitoring stack now secured, in the next section, you’ll learn how to configure an external monitoring target.
Test out your Prometheus Operator with an External VM
While Prometheus is optimized for Kubernetes environments, it can also monitor services running outside the cluster, including virtual machines. This is especially useful for hybrid deployments where legacy apps or backend jobs still run on UpCloud VMs.
If you don’t already have a VM with the Prometheus node exporter set up on it, you will learn in detail how to set up one in the next part. For now, you can run the following commands on any Linux-based VM to set up Node exporter on it. Make sure to note the public IP of the VM after you’re done.
To configure your Prometheus operator to scrape external services, you need to update the Prometheus Helm release (via the values.yaml file) to specify the host and port of the target VM:
prometheus:
  prometheusSpec:
    additionalScrapeConfigs:
    - job_name: "upcloud-vm"
      static_configs:
      - targets: ["<public ip>:9100"]
This will tell Prometheus to look for new targets from the given array and begin scraping them automatically.
Use Cases for VM Monitoring
- Legacy Applications: Track CPU, memory, disk, and network stats via Node Exporter installed on the VM.
- Cron Jobs or Services: Expose custom metrics from standalone applications (e.g., via /metrics HTTP endpoints).
- Hybrid Environments: Combine Kubernetes and VM observability in a single Prometheus instance for a complete view.
With this setup, you can monitor any VM alongside your Kubernetes workloads, using the same Prometheus queries and alerting rules. In the next section, we’ll look at how to validate that your configuration is working and that all targets are being scraped correctly.
Testing the Setup
Once Prometheus is configured to monitor both Kubernetes services and external VMs, it’s important to verify that everything is working as expected. Prometheus provides built-in ways to help you confirm that targets are being discovered, scraped, and stored properly.
Access the Prometheus Web UI
First, port-forward the Prometheus service so you can access its web interface locally:
kubectl port-forward svc/prometheus-stack-kube-prom-prometheus 9090 -n monitoringThen open your browser and go to http://localhost:9090.
Check Target Discovery
Navigate to Status > Target health in the Prometheus UI. You should see a list of all configured scrape targets, grouped by job name. Each target will show a status (e.g., UP) and scrape metrics such as latency and data size.
Make sure your external VM targets (e.g., upcloud-vm) are listed and in the UP state:
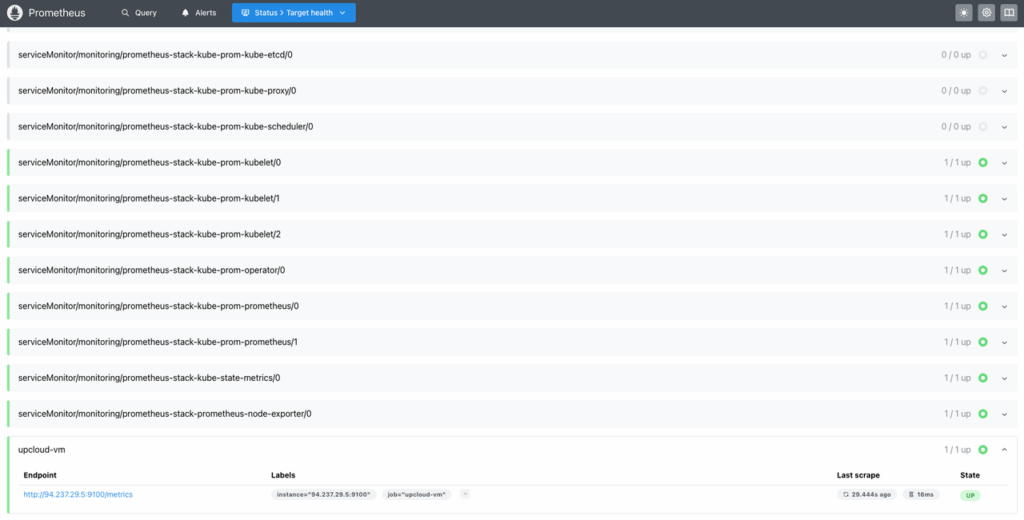
If not, double-check:
- The IP and port are correct.
- The VM’s firewall allows inbound traffic on the scrape port.
- The target file is mounted and referenced correctly in the scrape config.
Explore Metrics
Click Query and use PromQL queries to explore collected data. Try a few examples:
upThis basic query returns a list of all targets and their status.
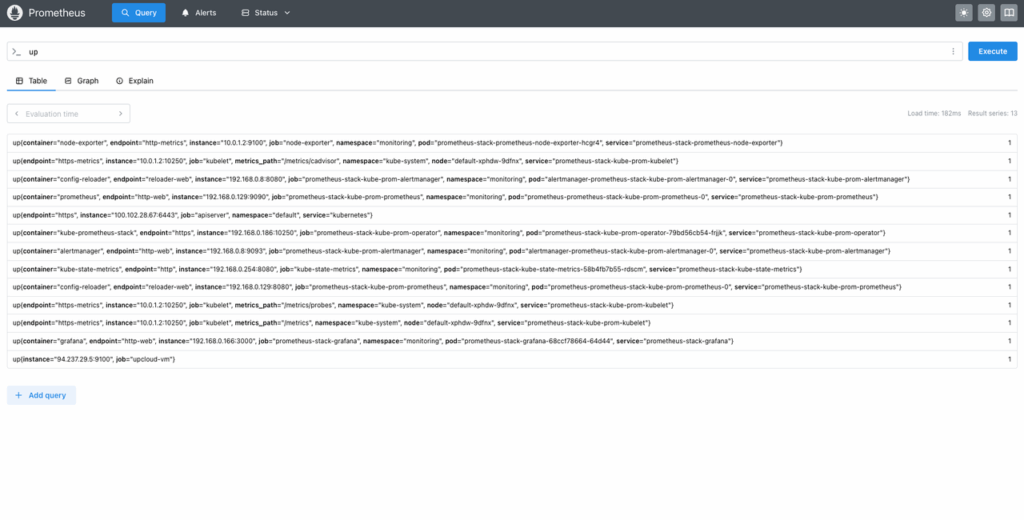
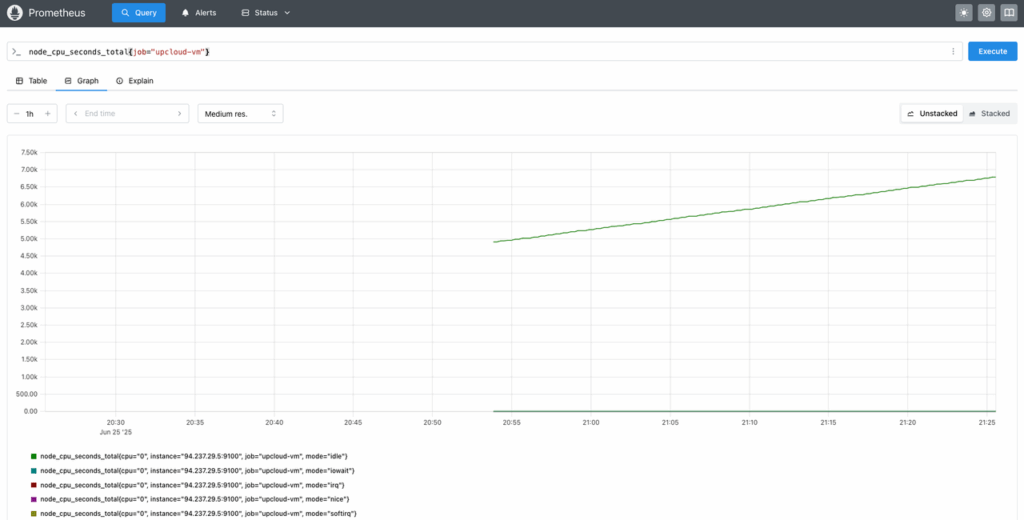
Next, try the following query:
node_cpu_seconds_total{job="upcloud-vm"}If Node Exporter is running on your VM, this query should return CPU metrics segmented by mode (idle, user, system, etc.). You can view it as a chart by switching to the Graph tab:
Up Next
By setting up a dedicated monitoring cluster on UpCloud’s Managed Kubernetes and deploying Prometheus using the kube-prometheus-stack, you’ve laid a solid foundation for centralized observability across your infrastructure. This setup ensures your monitoring workloads are isolated, scalable, and production-ready, capable of handling both containerized and traditional VM-based services.
You’ve also extended Prometheus beyond Kubernetes using static service discovery to bring external VMs into the fold. This flexibility is key for hybrid environments where legacy services, custom jobs, or standalone applications still play an important role. With a single Prometheus instance scraping both types of targets, you gain unified metrics, streamlined alerting, and a consistent query interface.
In Part 2, we’ll build on this setup by installing Node Exporter on your UpCloud VMs. You’ll learn how to collect key metrics like CPU usage, memory pressure, and disk I/O from each virtual machine and visualize them alongside your Kubernetes workloads, further closing the gap between cloud-native and legacy monitoring.
Discussion