If you’ve already explored our earlier guide, Understanding Distributed Tracing and Why Jaeger Matters, you know how tracing helps connect the dots between microservices, latency, and performance in modern systems.
If not, give it a quick read first it breaks down the core concepts and why tracing is essential in modern observability.
In this tutorial, you’ll put that theory into practice by deploying Jaeger, the open-source tracing system built for cloud-native environments, on UpCloud Managed Kubernetes. You’ll instrument a simple Node.js application with OpenTelemetry, send traces to Jaeger, and visualize complete request flows across services.
By the end, you’ll have a fully functioning tracing pipeline ready to extend, scale, and integrate into your broader observability stack on UpCloud.
Prerequisites
To follow along, you will need to have the following things set up:
- An UpCloud account with access to the Managed Kubernetes service. If you don’t have one yet, sign up here.
- upctl to provision and manage the UpCloud Kubernetes cluster and kubectl to interact with it.
- Helm installed on your local machine. Helm will be used to deploy Jaeger using the official chart from the jaegertracing Helm repository.
- Node.js and npm set up locally to build the test app that you will instrument
- Docker Desktop to build the image of the app, and a Docker Hub account to host it
- A basic understanding of Kubernetes concepts like namespaces, services, and port-forwarding.
With these in place, you’re ready to set up distributed tracing with Jaeger on UpCloud.
Provision a Kubernetes Cluster
Let’s begin by provisioning an UpCloud Managed Kubernetes cluster connected to a Private Network.
Step 1: Create a Private Network
Before creating your cluster, you’ll need a Private Network in the same zone. Enable DHCP and define your IP range by running the following command:
upctl network create \
  --name jaeger-net \
  --zone de-fra1 \
  --ip-network address=10.0.1.0/24,dhcp=true
Step 2: Provision the Kubernetes Cluster
With the network in place, use the upctl CLI to create a three-node cluster:
upctl k8s create \
  --name jaeger-cluster \
  --network jaeger-net \
  --zone de-fra1 \
  --plan "production-small" \
  --version 1.30 \
  --node-group name=monitoring-nodes,count=3,plan=4xCPU-8GB
For this tutorial, the production‑small plan offers a good balance: each node includes sufficient resources to handle Jaeger’s collector and query workloads under typical loads.
Step 3: Configure kubectl
Once the cluster is ready, fetch its kubeconfig and configure your kubectl CLI:
upctl k8s config jaeger-cluster --output yaml --write ./cluster-config.yaml
export KUBECONFIG=./cluster-config.yaml
You can now verify access to the cluster by running any kubectl get command:
kubectl get nodes
Set up Jaeger
With your Kubernetes cluster ready, it’s time to deploy Jaeger using the official Helm chart. This setup will install the Jaeger collector, query service, agent, and storage components in a single step, and expose OTLP endpoints for trace ingestion.
First, add the Jaeger Helm chart repository to your local Helm setup:
helm repo add jaegertracing: https://jaegertracing.github.io/helm-charts
helm repo update
You’ll deploy Jaeger into its own dedicated namespace observability, so create it by running the following command:
kubectl create namespace observability
Now install Jaeger with OTLP HTTP and gRPC endpoints enabled on its collector service:
helm install jaeger jaegertracing/jaeger \
  --namespace observability \
  --set collector.service.otlp.grpc.name=otlp-grpc \
  --set collector.service.otlp.grpc.port=4317 \
  --set collector.service.otlp.http.name=otlp-http \
  --set collector.service.otlp.http.port=4318
This will deploy Jaeger in the all-in-one mode, suitable for testing and small-scale environments. It exposes both OTLP gRPC and HTTP ports so you can send trace data using OpenTelemetry SDKs and agents.
Wait for some time for the Jaeger resources to come online. After a while, run the following command to forward the Jaeger Query UI to your local machine and test that it works:
export POD_NAME=$(kubectl get pods --namespace observability -l \
  "app.kubernetes.io/instance=jaeger,app.kubernetes.io/component=query" \
  -o jsonpath="{.items[0].metadata.name}")

kubectl port-forward --namespace observability $POD_NAME 8080:16686
Then open your browser and go to:
http://127.0.0.1:8080/
You should now see the Jaeger dashboard, where traces will begin to appear as soon as your applications start sending data.
Instrumenting Your Applications
To see the Jaeger setup in action, you need to instrument and deploy an application on the cluster.
For now, you will create a sample Node.js application and instrument it with OpenTelemetry. This app will expose an endpoint that counts characters in an input string and will emit distributed traces throughout its request lifecycle.
To start, create a new directory named nodejs-char-counter and run npm init -y to create a new Node.js project in it. Then, run the following command to install the required dependencies:
npm i @opentelemetry/api \
@opentelemetry/sdk-node \
@opentelemetry/auto-instrumentations-node \
@opentelemetry/exporter-trace-otlp-http  \
express
This will install the @opentelemetry/api and @opentelemetry/sdk-node to set up OpenTelemetry in Node.js environments, @opentelemetry/auto-instrumentations-node to set up basic auto-instrumentations, and @opentelemetry/exporter-trace-otlp-http to export the trace data to Jaeger over HTTP.Now you can start building the app. First of all, create a tracing.js file to set up the OpenTelemetry SDK with the OTLP exporter that sends the trace data to Jaeger. Save the following code in it:
// tracing.js
const { NodeSDK } = require('@opentelemetry/sdk-node');
const { OTLPTraceExporter } = require('@opentelemetry/exporter-trace-otlp-http');
const { getNodeAutoInstrumentations } = require('@opentelemetry/auto-instrumentations-node');

const otlpExporter = new OTLPTraceExporter({
  url: process.env.OTEL_EXPORTER_OTLP_TRACES_ENDPOINT || 'http://jaeger-collector.observability.svc.cluster.local:4318/v1/traces',
});

const sdk = new NodeSDK({
  traceExporter: otlpExporter,
  instrumentations: [getNodeAutoInstrumentations()],
  serviceName: process.env.SERVICE_NAME || 'nodejs-char-counter',
  serviceVersion: process.env.SERVICE_VERSION || '1.0.0',
});

sdk.start();

console.log('OpenTelemetry tracing initialized');

process.on('SIGTERM', () => {
  sdk.shutdown().finally(() => process.exit(0));
});

module.exports = sdk;
This file ensures that the exporter is configured with the correct Jaeger collector endpoint (http://jaeger-collector.observability.svc.cluster.local:4318/v1/traces), and all outbound HTTP calls, middleware executions, and custom spans are captured and exported to Jaeger.
Next, create a file named charCounter.js. The actual business logic of the character-counting app will live here. It will receive a string, count its characters, and emit custom spans with metadata and events.
// charCounter.js
const { trace, SpanStatusCode } = require('@opentelemetry/api');
const tracer = trace.getTracer('char-counter-service', '1.0.0');

function countCharacters(input) {
  const span = tracer.startSpan('count_characters', {
    attributes: {
      'operation.type': 'character_counting',
      'input.provided': !!input,
      'input.type': typeof input
    }
  });

  try {
    if (!input) {
      span.setAttributes({ 'input.is_empty': true, 'character.count': 0 });
      span.setStatus({ code: SpanStatusCode.OK, message: 'Empty input processed' });
      return { characterCount: 0, originalInput: input, inputType: typeof input, isEmpty: true };
    }

    const stringInput = String(input);
    const characterCount = stringInput.length;

    span.setAttributes({
      'character.count': characterCount,
      'input.length': stringInput.length,
      'input.is_empty': characterCount === 0,
      'input.has_spaces': stringInput.includes(' '),
      'input.has_special_chars': /[^a-zA-Z0-9\s]/.test(stringInput)
    });

    span.addEvent('character_counting_started', { 'input.preview': stringInput.substring(0, 50) });
    span.addEvent('character_counting_completed', { 'result.count': characterCount });
    span.setStatus({ code: SpanStatusCode.OK, message: 'Character counting successful' });

    return { characterCount, originalInput: stringInput, inputType: typeof input, isEmpty: characterCount === 0 };

  } catch (error) {
    span.recordException(error);
    span.setStatus({ code: SpanStatusCode.ERROR, message: `Error counting characters: ${error.message}` });
    throw error;
  } finally {
    span.end();
  }
}

module.exports = { countCharacters };
The core logic used for character counting is String(input).length. Two cases of input (empty and non-empty have been handled separately in the countCharacters function, with each of them generating different traces.
Now, create the app.js file to wire everything together. Save the following contents in it:
// app.js
require('./tracing');

const express = require('express');
const { trace, context, SpanStatusCode } = require('@opentelemetry/api');
const { countCharacters } = require('./charCounter');

const app = express();
const port = process.env.PORT || 3000;

// Get a tracer instance for the main app
const tracer = trace.getTracer('express-app', '1.0.0');

// Middleware for JSON parsing
app.use(express.json());

// Health check endpoint
app.get('/health', (req, res) => {
  const span = trace.getActiveSpan();
  if (span) {
    span.setAttributes({
      'endpoint': '/health',
      'http.method': 'GET'
    });
  }

  res.status(200).json({
    status: 'healthy',
    service: 'nodejs-char-counter',
    timestamp: new Date().toISOString()
  });
});

// Main character counting endpoint
app.get('/', (req, res) => {
  // Start a custom span for this endpoint
  const span = tracer.startSpan('character_count_endpoint', {
    attributes: {
      'http.method': 'GET',
      'http.route': '/',
      'endpoint.name': 'character_count'
    }
  });

  // Run the rest of the operation within this span's context
  context.with(trace.setSpan(context.active(), span), () => {
    try {
      const { input } = req.query;

      // Add request attributes to the span
      span.setAttributes({
        'request.has_input_param': !!input,
        'request.query_params_count': Object.keys(req.query).length,
        'user_agent': req.get('User-Agent') || 'unknown'
      });

      // Add event for request received
      span.addEvent('request_received', {
        'query_params': JSON.stringify(req.query),
        'input_provided': !!input
      });

      // Call the character counting function (this will create its own span)
      const result = countCharacters(input);

      // Add response attributes to the span
      span.setAttributes({
        'response.character_count': result.characterCount,
        'response.input_was_empty': result.isEmpty,
        'response.status_code': 200
      });

      // Add event for successful processing
      span.addEvent('processing_completed', {
        'character_count': result.characterCount,
        'processing_successful': true
      });

      // Set success status
      span.setStatus({ code: SpanStatusCode.OK, message: 'Request processed successfully' });

      // Return the response
      res.status(200).json({
        input: result.originalInput,
        characterCount: result.characterCount,
        isEmpty: result.isEmpty,
        metadata: {
          inputType: result.inputType,
          service: 'nodejs-char-counter',
          timestamp: new Date().toISOString()
        }
      });

    } catch (error) {
      // Handle any unexpected errors
      console.error('Error processing request:', error);

      span.recordException(error);
      span.setAttributes({
        'error.type': 'processing_error',
        'response.status_code': 500
      });

      span.setStatus({
        code: SpanStatusCode.ERROR,
        message: `Processing error: ${error.message}`
      });

      res.status(500).json({
        error: 'Internal server error',
        message: 'An error occurred while processing your request'
      });
    } finally {
      // Always end the span
      span.end();
    }
  });
});

// Error handling middleware
app.use((err, req, res, next) => {
  console.error('Unhandled error:', err);

  const span = trace.getActiveSpan();
  if (span) {
    span.recordException(err);
    span.setAttributes({
      'error.type': 'unhandled_error',
      'response.status_code': 500
    });
  }

  res.status(500).json({
    error: 'Internal Server Error',
    message: 'An unexpected error occurred'
  });
});

// Start the server
app.listen(port, () => {
  console.log(`Character counter service running on port ${port}`);
  console.log(`Health check available at: http://localhost:${port}/health`);
  console.log(`Character counting at: http://localhost:${port}/?input=your-text-here`);
});

module.exports = app;
This Node.js app uses ExpressJS to create a simple REST server, with the following endpoints exposed:
- /: The character counter endpoint, which expects a GET request with the input string passed in as a query parameter named input.
- /health: A health check endpoint to know if the service is up and running.
It also implements an error-handling middleware to catch all unhandled errors from the app and collect their traces for further investigation.
Make sure to add a new script start in the package.json file to start the app:
{
  "name": "nodejs-char-counter",
  "version": "1.0.0",
  "scripts": {
    // Add the following script
    "start": "node app.js",
    "dev": "nodemon app.js"
  },
  "dependencies": {
    "@opentelemetry/api": "^1.9.0",
    "@opentelemetry/auto-instrumentations-node": "^0.62.1",
    "@opentelemetry/exporter-trace-otlp-http": "^0.203.0",
    "@opentelemetry/sdk-node": "^0.203.0",
    "express": "^5.1.0"
  },
  "devDependencies": {
    "nodemon": "^3.0.1"
  }
}
The app is now ready. You can try running npm start to test it locally.
If all looks good, you can then create the following Dockerfile to containerize the app:
FROM node:24-alpine

# Set working directory
WORKDIR /usr/src/app

# Copy package files
COPY package*.json ./

# Set environment variables
ENV NODE_ENV=production

# Install dependencies
RUN npm ci --omit=dev && npm cache clean --force

# Copy application code
COPY . .

# Create non-root user
RUN addgroup -g 1001 -S nodejs
RUN adduser -S nodejs -u 1001

# Change ownership of the app directory
RUN chown -R nodejs:nodejs /usr/src/app
USER nodejs

# Expose port
EXPOSE 3000

# Health check
HEALTHCHECK --interval=30s --timeout=3s --start-period=5s --retries=3 \
  CMD node -e "require('http').get('http://localhost:3000/health', (res) => { \
    if (res.statusCode === 200) process.exit(0); else process.exit(1); \
  }).on('error', () => process.exit(1))"

# Start the application
CMD ["npm", "start"]
This setup runs the app as a non-root user, defines liveness health checks, and ensures compact image size using node:24-alpine.
With the Dockerfile in place, build and push the image to Docker Hub by running the following commands, replacing <your-dockerhub-username> with your actual Docker Hub username:
docker build -t <your-dockerhub-username>/nodejs-char-counter:latest .
docker push <your-dockerhub-username>/nodejs-char-counter:latest
If you are using an ARM architecture machine (such as a Mac with an Apple Silicon chip), you will need to use Docker Buildx to ensure that the Docker image is built for linux/amd64, not ARM:
docker buildx build --platform linux/amd64 -t <your-dockerhub-username>/nodejs-char-counter:latest . --pushFinally, you can deploy the app on your cluster by creating a Deployment and Service resource manifest for it. To do that, save the following in a file named deployment.yaml:
apiVersion: apps/v1
kind: Deployment
metadata:
  name: nodejs-char-counter
  namespace: default
  labels:
    app: nodejs-char-counter
    version: v1
spec:
  replicas: 1
  selector:
    matchLabels:
      app: nodejs-char-counter
  template:
    metadata:
      labels:
        app: nodejs-char-counter
        version: v1
    spec:
      containers:
      - name: nodejs-char-counter
        image: <your-dockerhub-username>/nodejs-char-counter:latest
        ports:
        - containerPort: 3000
          name: http
        env:
        - name: SERVICE_NAME
          value: "nodejs-char-counter"
        - name: SERVICE_VERSION
          value: "1.0.0"
        - name: OTEL_EXPORTER_OTLP_TRACES_ENDPOINT
          value: "http://jaeger-collector.observability.svc.cluster.local:4318/v1/traces"
        - name: OTEL_TRACES_EXPORTER
          value: "otlp"
        - name: OTEL_EXPORTER_OTLP_PROTOCOL
          value: "http/protobuf"
        - name: OTEL_RESOURCE_ATTRIBUTES
          value: "service.name=nodejs-char-counter,service.version=1.0.0,deployment.environment=production"
        - name: OTEL_TRACES_SAMPLER
          value: "traceidratio"
        - name: OTEL_TRACES_SAMPLER_ARG
          value: "1.0"  # Sample all traces for demo (use 0.1 for 10% in production)
        resources:
          requests:
            memory: "128Mi"
            cpu: "100m"
          limits:
            memory: "256Mi"
            cpu: "200m"
        livenessProbe:
          httpGet:
            path: /health
            port: 3000
          initialDelaySeconds: 30
          periodSeconds: 10
          timeoutSeconds: 5
          failureThreshold: 3
        readinessProbe:
          httpGet:
            path: /health
            port: 3000
          initialDelaySeconds: 5
          periodSeconds: 5
          timeoutSeconds: 3
          failureThreshold: 3
        securityContext:
          runAsNonRoot: true
          runAsUser: 1001
          allowPrivilegeEscalation: false
          capabilities:
            drop:
            - ALL
---
apiVersion: v1
kind: Service
metadata:
  name: nodejs-char-counter-service
  namespace: default
  labels:
    app: nodejs-char-counter
spec:
  selector:
    app: nodejs-char-counter
  ports:
  - port: 80
    targetPort: 3000
    protocol: TCP
    name: http
  type: ClusterIP
It configures resource limits, probes, and the necessary Jaeger environment variables:
- SERVICE_NAME: This name will be attached to the traces exported from the app
- SERVICE_VERSION: The version of the app will be attached to the traces as well.
- OTEL_EXPORTER_OTLP_TRACES_ENDPOINT: You can override the default Jaeger collector endpoint that you have defined in your Node.js app using this variable, should you ever need to.
- OTEL_TRACES_EXPORTER: Configures the OpenTelemetry traces exporter to use OTLP for exports.
- OTEL_EXPORTER_OTLP_PROTOCOL: Configures the OpenTelemetry traces exporter to usehttp/protobuf` for exports
- OTEL_RESOURCE_ATTRIBUTES: Adds metadata to the traces.
- OTEL_TRACES_SAMPLER: Controls how traces are sampled before they are exported. traceidratio configures the SDK to sample a percentage of spans based on the trace ID. Used with OTEL_TRACES_SAMPLER_ARG to define the percentage of traces retained (1.0 means 100%).
Now, all you need to do is replace <your-dockerhub-username> in the image name with your DockerHub username and then apply this manifest to your cluster:
kubectl apply -f deployment.yaml
Once the app is running, set up port-forwarding to send requests to it from your local machine:
kubectl port-forward svc/nodejs-char-counter-service 3000:80
Send requests by either opening up http://localhost:3000/?input=Hello%20UpCloud in the browser or via cURL:
curl “http://localhost:3000/?input=Hello%20UpCloud”
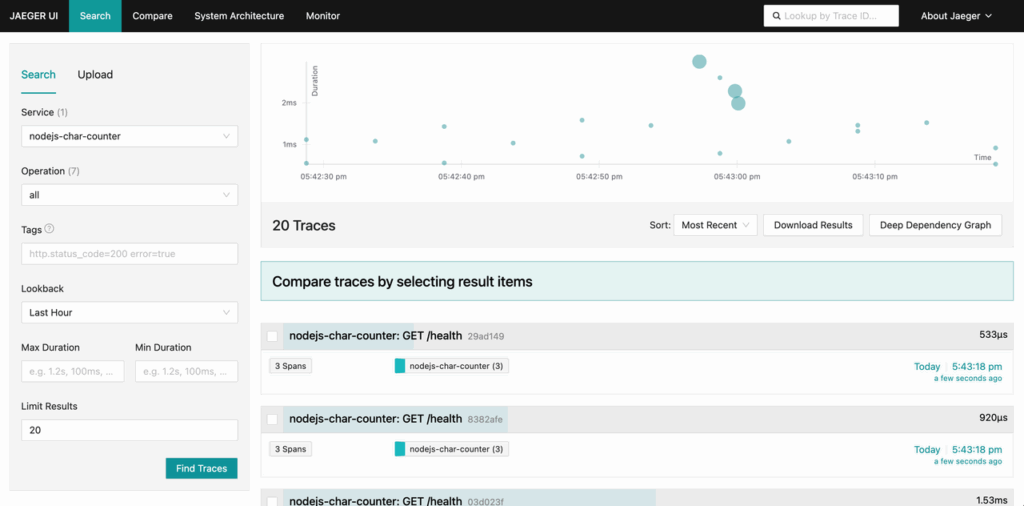
You can now visit the Jaeger UI at http://127.0.0.1:8080 and should see something like this:
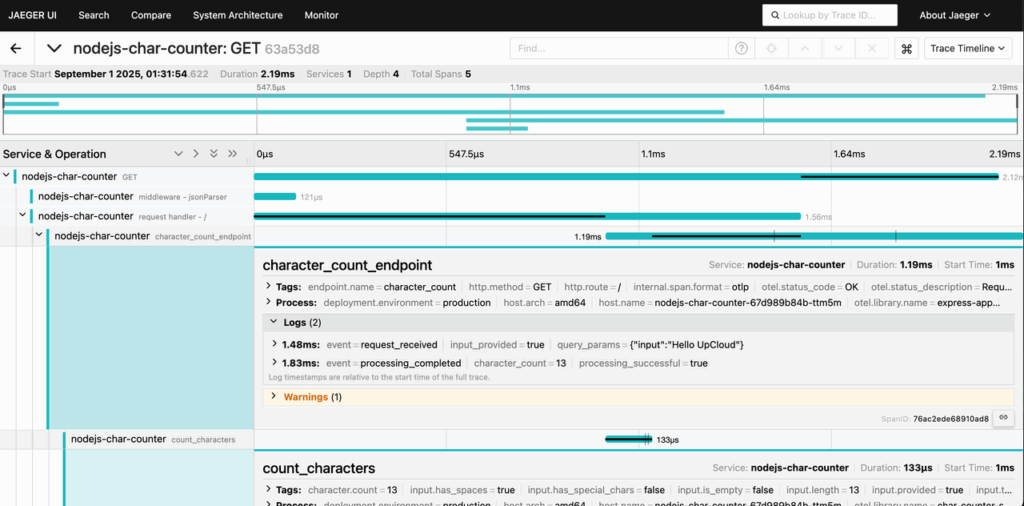
You can drill into spans to inspect attributes, execution flow, and error details across the traced request:
Next Steps and Best Practices
While the all-in-one Jaeger setup works well for testing and small workloads, production environments typically require persistent storage and centralized trace management. By default, traces in this setup are held in memory and lost after pod restarts. To retain traces over longer periods, consider backing Jaeger with a durable storage backend like Elasticsearch or Apache Cassandra. These can be configured via Helm values and provide search, aggregation, and high-volume ingestion capabilities.
You’ll also want to fine-tune your sampling strategy. Collecting 100% of all traces can overwhelm your system and storage, especially in high-throughput applications. Jaeger supports probabilistic and tail-based sampling. For most production setups, a traceidratio sampler with a 10%–20% sampling rate offers a good balance between observability and performance.
If you operate in a multi-cluster setup, consider deploying a centralized Jaeger collector behind a load balancer or ingress, and configure each cluster to export spans to that central endpoint. This allows you to consolidate traces across regions, improve correlation between services, and simplify long-term storage management.
Conclusion
Distributed tracing gives you a powerful lens into the operation of modern applications. With Jaeger deployed on UpCloud Kubernetes and your application instrumented using OpenTelemetry, you now have a complete pipeline to capture, visualize, and analyze traces in real time.
Whether you’re debugging slow requests, identifying bottlenecks, or simply gaining a better understanding of service-to-service communication, tracing offers the context that logs and metrics alone can’t provide. As your infrastructure evolves, you can extend this setup with persistent storage backends, advanced sampling, and centralized collectors to support production-scale workloads.
Discussion