In our earlier guide, What is OpenTelemetry? Understanding the Standard for Cloud-Native Observability, we explained how OpenTelemetry standardizes the collection of metrics, traces, and logs across distributed systems. Then, in the follow-up tutorial, How to Deploy OpenTelemetry on UpCloud Managed Kubernetes, we showed how to put those concepts into practice by deploying the OpenTelemetry Collector and instrumenting a Python application on UpCloud’s infrastructure.
That setup was intentionally lean. It used the Collector’s debug exporter (no persistence) and, optionally, an external backend such as Grafana Cloud, which provides short-term retention (~3 days for traces and ~14 days for metrics on the free tier). This is perfect for smoke tests and immediate feedback, but not enough for trend analysis, capacity planning, compliance, or post-incident reviews.
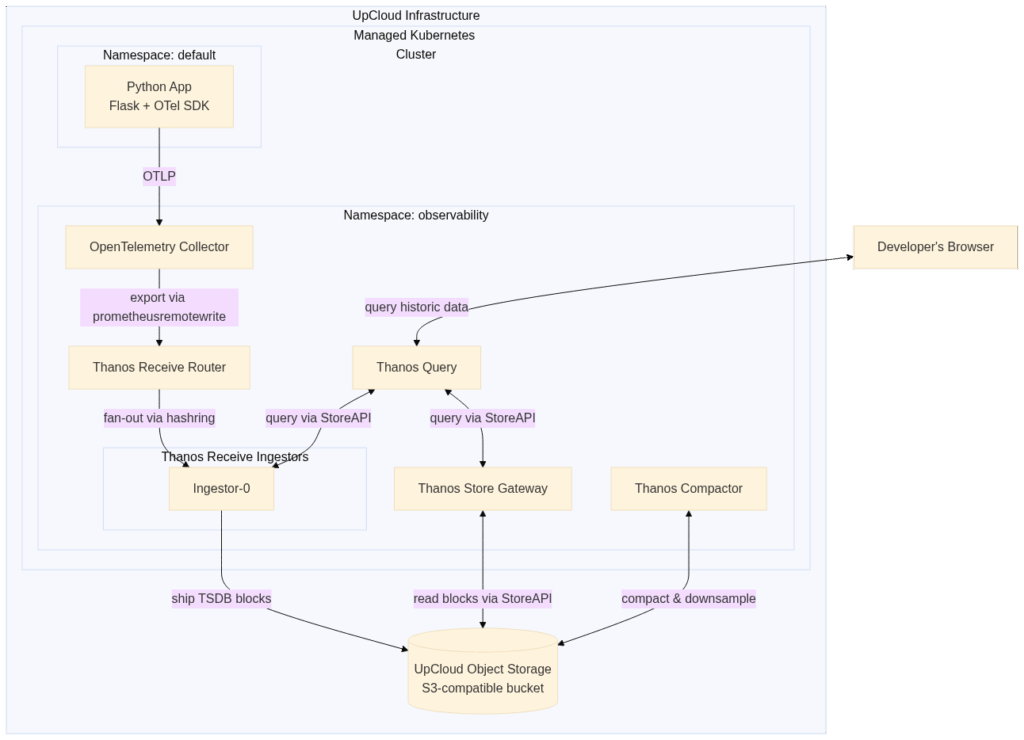
This tutorial closes that gap by adding Thanos for cost-efficient, long-term metrics storage and scalable querying. You’ll configure the Thanos Receive component to ingest OTLP metrics directly from your OpenTelemetry Collector, persist them to UpCloud Object Storage, and explore historical data through Thanos Query.
With compaction and optional downsampling, you’ll keep storage predictable while unlocking fast queries over months of history. This will enable SLO tracking, seasonality insights, regression detection, and auditability without overburdening your cluster.
Prerequisites
Before you can go ahead with this tutorial, you will need to ensure that you have the following:
- An existing OpenTelemetry Collector + sample Python app setup on an UpCloud Managed Kubernetes cluster (from Part 1 of this series).
- An UpCloud Object Storage instance ready for long-term metric retention.
- kubectl, helm, and upctl installed and configured correctly.
- Basic knowledge of Kubernetes and OpenTelemetry concepts.
If you successfully completed Part 1, your environment already satisfies most of these requirements. The only additional step you’ll need before deploying Thanos is to prepare object storage access for it.
Step 1: Create an UpCloud Object Storage Bucket
Thanos Receiver writes ingested metrics into object storage for durability and long-term querying. Head to your UpCloud Control Panel and navigate to Object Storage. From here:
- Create a new object storage instance.
- Add a bucket inside that instance to store metric blocks.
- Create a new User for this storage instance.
- Attach the ECSS3FullAccess policy to that user.
- Generate and download the access key and secret key.
You will find detailed instructions in this guide.
Keep the following details handy before moving ahead:
- Bucket name
- Object storage endpoint (region-specific)
- Access key
- Secret key
Step 2: Create a Config Secret to Store the Bucket Details
Thanos needs an objstore.yml file with your object storage credentials to connect to the bucket. Create a file named objstore.yml with the following content (replace placeholders with your own values):
type: S3
config:
  bucket: "<your-bucket-name>"
  endpoint: "<your-endpoint>.upcloudobjects.com"
  access_key: "<your-access-key>"
  secret_key: "<your-secret-key>"
  insecure: false

Now create a Kubernetes secret from this file:
kubectl create secret generic thanos-objstore-config \
  --from-file=objstore.yml \
  -n observability
This secret will be referenced by Thanos components to persist and read back metric blocks.
Step 3: Prepare a Hashring ConfigMap
The Thanos Receive Router requires a hashring configuration to decide how to forward writes to the store, especially in multi-tenant environments. Even in a single-replica setup, this configuration must exist. Create a file called hashrings.json with the following:
[
  {
    "tenant": "default",
    "endpoints": [
      "thanos-receive-ingestor-0.thanos-receive-ingestor.observability.svc.cluster.local:10901"
    ]
  }
]
Apply it to the cluster:
kubectl create configmap hashring-config \
  --from-file=hashrings.json \
  -n observability
With your cluster from Part 1, an UpCloud Object Storage bucket, and these Kubernetes objects prepared, you’re ready to deploy Thanos Receiver and extend your observability stack with long-term, cost-efficient metric retention.
Deploy Thanos with kube-thanos and Jsonnet
We’ll use kube-thanos’ Jsonnet library to generate lean Kubernetes manifests for all Thanos components you need in this part: Receive (router + ingestor), Store Gateway, Query, and Compactor. All of these will be scoped to the observability namespace and connected to your thanos-objstore-config Secret and hashring-config ConfigMap.
Here’s what the setup will look like at a high level:
Step 1: Install Jsonnet tooling
To start, first install jsonnet tooling on your system:
go install github.com/jsonnet-bundler/jsonnet-bundler/cmd/jb@latest
go install github.com/google/go-jsonnet/cmd/jsonnet@latest
Ensure $GOPATH/bin (or your Go bin path) is on your PATH.
Step 2: Set up kube-thanos locally
Once jb and jsonnet are ready, run the following commands in a fresh working directory (containing your objstore.yml Secret and hashring-config already applied):
jb init
jb install github.com/thanos-io/kube-thanos/jsonnet/[email protected]
This creates a vendor/ folder with the kube-thanos Jsonnet library.
Step 3: Create the Jsonnet configuration
To configure details like the Thanos image, object storage credentials secret mapping, hashring config mapping, and other specific details about the Thanos setup, you will need to save the following code in a new file named config.jsonnet:
local t = import 'kube-thanos/thanos.libsonnet';

// Shared knobs for all components
local commonConfig = {
  config+:: {
    local cfg = self,
    namespace: 'observability',
    version: 'v0.31.0',
    image: 'quay.io/thanos/thanos:' + cfg.version,
    imagePullPolicy: 'IfNotPresent',

    // Point Thanos components (store/receive/compact) to your Secret:
    //   kubectl -n observability create secret generic thanos-objstore-config \
    //     --from-file=objstore.yaml=/path/to/thanos-s3.yaml
    objectStorageConfig: {
      name: 'thanos-objstore-config',
      key:  'objstore.yml',
    },

    hashringConfigMapName: 'hashring-config', // required by Receive
    volumeClaimTemplate: {
      spec: {
        accessModes: ['ReadWriteOnce'],
        resources: { requests: { storage: '10Gi' } },
      },
    },
  },
};

// -------------------- Thanos Receive (ingestors + router) --------------------

// Ingestors: enable shipping to object storage by inheriting commonConfig.objectStorageConfig
// and disable ServiceMonitor generation.
local i = t.receiveIngestor(commonConfig.config {
  replicas: 1,
  replicaLabels: ['receive_replica'],
  replicationFactor: 1,
  serviceMonitor: false,
});

// Router: forwards Prometheus Remote Write to ingestors via the hashring.
// (Router doesn't generate a ServiceMonitor in kube-thanos.)
local r = t.receiveRouter(commonConfig.config {
  replicas: 1,
  replicaLabels: ['receive_replica'],
  replicationFactor: 1,
  endpoints: i.endpoints,
});

// ----------------------------- Store & Query ---------------------------------

// Store Gateway: reads blocks from S3 (uses objectStorageConfig); no ServiceMonitor.
local s = t.store(commonConfig.config {
  replicas: 1,
  serviceMonitor: false,
});

// Query: points to Store + Receive store endpoints; no ServiceMonitor.
local q = t.query(commonConfig.config {
  replicas: 1,
  replicaLabels: ['prometheus_replica', 'rule_replica'],
  serviceMonitor: false,
  stores: [s.storeEndpoint] + i.storeEndpoints,
});

// -------------------------------- Compactor ----------------------------------

// Compactor: compacts/downsampes S3 blocks; no ServiceMonitor.
local c = t.compact(commonConfig.config {
  replicas: 1,
  serviceMonitor: false,
});

// --------------------------- Render to files ---------------------------------

// Flatten objects to per-component YAMLs the build script can convert to *.yaml.
{
  ['thanos-store-' + name]: s[name]
  for name in std.objectFields(s)
} +
{
  ['thanos-query-' + name]: q[name]
  for name in std.objectFields(q)
} +
{
  ['thanos-receive-router-' + name]: r[name]
  for name in std.objectFields(r)
} +
{
  // receiveIngestor returns top-level bits + a nested "ingestors" map (per ring)
  ['thanos-receive-ingestor-' + name]: i[name]
  for name in std.objectFields(i)
  if name != 'ingestors'
} +
{
  ['thanos-receive-ingestor-' + ring + '-' + name]: i.ingestors[ring][name]
  for ring in std.objectFields(i.ingestors)
  for name in std.objectFields(i.ingestors[ring])
  if i.ingestors[ring][name] != null
} +
{
  ['thanos-compact-' + name]: c[name]
  for name in std.objectFields(c)
}
Similar to the example.jsonnet file in the kube-thanos repo, this configuration file defines a Thanos setup that gives you:
- Receive Router (fan-out) + Receive Ingestor (writes TSDB blocks & ships to object storage)
- Store Gateway (reads historical blocks from object storage)
- Query (PromQL UI + federation across Receive/Store)
- Compactor (compaction & optional downsampling for cost/latency trade-offs)
All components target the observability namespace and reference the thanos-objstore-config secret (your objstore.yml) and the hashring-config configmap.
Step 4: Render manifests
To be able to use the JSONNET file to generate Kubernetes manifests, you’ll need to run the jsonnet and gojsontoyaml tools you installed earlier. Here’s a handy little batch script to help configure the options for these tools and chain them together for your convenience:
#!/usr/bin/env bash
set -euo pipefail
JSONNET=${JSONNET:-jsonnet}
GOJSONTOYAML=${GOJSONTOYAML:-gojsontoyaml}
rm -rf manifests && mkdir manifests
$JSONNET -J vendor -m manifests "${1-example.jsonnet}" \
  | xargs -I{} sh -c "cat {} | $GOJSONTOYAML > {}.yaml; rm -f {}" -- {}
find manifests -type f ! -name '*.yaml' -delete
Save the script in a file named build.sh and run ./build.sh config.jsonnet to generate your Thanos manifests. This will write one .yaml per generated manifest under the manifests/ directory.
Step 5: Apply to the cluster
To apply the generated manifests to your cluster and start up Thanos, run the following command:
kubectl apply -f manifests/
In a few minutes, you should see resources created for:
- thanos-receive-ingestor-* (StatefulSet + Service)
- thanos-receive-router (Deployment + Service)
- thanos-store (StatefulSet + Service)
- thanos-query (Deployment + Service)
- thanos-compact (StatefulSet)
You can verify it by running the following command:
kubectl -n observability get pods
Make sure to wait until all pods are Running/Ready before moving ahead.
Optional: Faster feedback while testing
The Thanos ingestor cuts, compacts, and uploads blocks on a 2-hour interval. This means that you might need to wait for two hours to see your first block get uploaded to your object storage after setting everything up. If you want to check it out sooner, you can temporarily shrink the receive ingestor’s TSDB block duration so uploads to object storage happen frequently.
To do that, run the following command:
kubectl -n observability patch sts thanos-receive-ingestor-default \
  --type='json' \
  -p='[{"op":"add","path":"/spec/template/spec/containers/0/args/-","value":"--tsdb.min-block-duration=2m"},
       {"op":"add","path":"/spec/template/spec/containers/0/args/-","value":"--tsdb.max-block-duration=2m"}]'

kubectl -n observability rollout status sts/thanos-receive-ingestor-default
Later, bump back to something saner (or remove both to use ~2h defaults):
# 15-minute blocks are a good middle ground for labs
kubectl -n observability patch sts thanos-receive-ingestor-default \
  --type='json' \
  -p='[{"op":"replace","path":"/spec/template/spec/containers/0/args","value":["--tsdb.min-block-duration=15m","--tsdb.max-block-duration=15m"]}]'

kubectl -n observability rollout status sts/thanos-receive-ingestor-default
With Thanos now running, the next step is to point your OpenTelemetry Collector at the Receive router using the prometheusremotewrite exporter, then send requests to your Python app and watch metrics flow into Thanos and persist to object storage.
Configure the OpenTelemetry Collector to Send Metrics to Thanos
Now that Thanos is running, the next step is to connect your OpenTelemetry pipeline so metrics flow end-to-end. The idea is simple: your applications keep exporting OTLP signals, the Collector translates them into Prometheus Remote Write, and those metrics are pushed straight into the Thanos Receive router.
Why the extra step with the Collector in the middle? Thanos Receive only understands Prometheus Remote Write. By letting the Collector handle the OTLP to Prometheus conversion, your applications stay Thanos-agnostic while still benefiting from its long-term storage and query capabilities.
Step 1: Define the Collector configuration
Start by creating or updating a file named otel-values.yaml. Unless you’ve customized service names, you can use the following as-is:
mode: 'deployment'

image:
  repository: "otel/opentelemetry-collector-contrib"

replicaCount: 1

presets:
  clusterMetrics:
    enabled: true
  kubernetesEvents:
    enabled: true

config:
  receivers:
    otlp:
      protocols:
        grpc:
          endpoint: 0.0.0.0:4317
        http:
          endpoint: 0.0.0.0:4318
    hostmetrics:
      collection_interval: 60s
      scrapers: { cpu: {}, memory: {}, load: {} }

  exporters:
    debug:
      verbosity: detailed
    prometheusremotewrite:
      endpoint: http://thanos-receive-router.observability.svc.cluster.local:19291/api/v1/receive

  extensions:
    health_check:
      endpoint: "0.0.0.0:13133"

  service:
    telemetry:
      logs:
        level: debug
    extensions: [health_check]
    pipelines:
      traces:
        receivers: [otlp]
        exporters: [debug]
      metrics:
        receivers: [otlp, hostmetrics]
        exporters: [debug, prometheusremotewrite]
      logs:
        receivers: [otlp]
        exporters: [debug]
Here are the important nodes to keep in mind:
- Receivers: You had already defined otlp (HTTP + gRPC) for your apps. You can optionally add hostmetrics for node basics.
- Exporter: Add the prometheusremotewrite exporter targeting the Thanos Receive router service on port 19291. Make sure to add to config.service.pipelines.metrics.exporters as well.
- Pipelines: Metrics flow to both debug (easy troubleshooting) and prometheusremotewrite (Thanos ingest).
Step 2: Install/upgrade the Collector (Helm)
With this updated values.yaml file, upgrade your OpenTelemetry Collector Helm installation by running the following command:
helm upgrade --install otel-collector-cluster \
  open-telemetry/opentelemetry-collector \
  -n observability \
  -f otel-values.yaml
Step 3: Confirm that Collector to Thanos Receive Exports are Working
Confirm the Collector is successfully remote-writing by looking at the logs:
kubectl -n observability logs deploy/otel-collector-cluster-opentelemetry-collector \
  | grep -i prometheusremotewrite | tail -n +1
# Expect periodic 200 OK / "remote write request successful" lines
Optionally, you can also peek at the router’s /metrics to see it working:
kubectl -n observability port-forward svc/thanos-receive-router 10902:10902
curl -s localhost:10902/metrics
At this point, your setup is complete! Your Python app is generating OTLP metrics, traces, and logs, and is sending them to the OTel Collector. The Collector is sending metrics off to the Thanos Receive Router, which is routing them to the Thanos Receive Ingestor. The Ingestor is uploading the TSDB blocks to the configured UpCloud Object Storage bucket.
Thanos Store is then querying those data blocks so that you can view them in Thanos Query UI. Compaction runs on the storage bucket to keep storage usage low over the long term. You’ll see all this in action next!
If you temporarily set short TSDB blocks on the ingestor (earlier), uploads to object storage will happen faster. This can be very useful while validating the pipeline. However, as mentioned before, you’ll want to revert to longer blocks later for cost/performance balance.
Generate Some Traffic on Your App
You’ll reuse the OTLP-instrumented Flask app from Part 1 to generate real traffic and metrics. To do that, port-forward the service and hit the / route a bunch of times to emit some spans, logs, and metrics:
kubectl port-forward svc/python-app 8080:80
# in a separate shell:
for i in $(seq 1 200); do curl -s http://localhost:8080/ >/dev/null; done
What metrics should you expect?
With opentelemetry-instrumentation-flask and the OTel metrics pipeline enabled, you’ll typically see HTTP server metrics exposed using Prometheus-compatible names derived from OTel semantic conventions, for example:
- http_server_active_requests
- http_server_duration_milliseconds_* (histogram family)
- process_* and python_* runtime metrics (if present in your env)
- Host/node metrics via Collector’s hostmetrics receiver (e.g., system_cpu_time_*, system_memory_*)
Note: OTel metric names map from OTel instruments (e.g., http.server.active_requests) to Prometheus-style names (e.g., http_server_active_requests). You’ll see how to query these via Thanos Query up next.
Exploring Thanos After Setup
Now that your pipeline is complete, it’s time to explore the setup.
Step 1: Verify Receive and Ingestor Health
Check that the Thanos Receive router and ingestors are alive and responding:
$  otel-p2 kubectl get pods -n observability
NAME                                                             READY   STATUS    RESTARTS   AGE
otel-collector-cluster-opentelemetry-collector-96ffd4f6b-b67b8   1/1     Running   0          5h52m
thanos-compact-0                                                 1/1     Running   0          7h48m
thanos-query-744cc4688b-xbdbp                                    1/1     Running   0          7h48m
thanos-receive-ingestor-default-0                                1/1     Running   0          4h51m
thanos-receive-router-867bb49bf9-9ghl8                           1/1     Running   0          7h48m
thanos-store-0                                                   1/1     Running   0          7h48m
Then confirm they are serving metrics:
kubectl -n observability port-forward svc/thanos-receive-router 10902:10902
curl -s localhost:10902/metrics
You should see counters like thanos_receive_write_timeseries that should denote the amount of data received in incoming write requests.
Step 2: Confirm Block Uploads to Object Storage
Logs from the ingestor will tell you if TSDB blocks are making it into your UpCloud Object Storage bucket:
kubectl -n observability logs statefulset/thanos-receive-ingestor-defaultLook for lines like:
level=info ts=2025-09-15T10:27:57Z caller=shipper.go:334 msg="upload new block" id=01JZ0NY0MQCY5PTN9T6P8J7HQMIf you see Access Denied or missing credentials errors, revisit your objstore.yml secret.
Step 3: Explore the Thanos Query UI
Port-forward the Thanos Query service:
kubectl -n observability port-forward svc/thanos-query 9090:9090Open http://localhost:9090 in your browser. Check the Stores tab. You should see:
- One or more Receive ingestors
- The Store Gateway
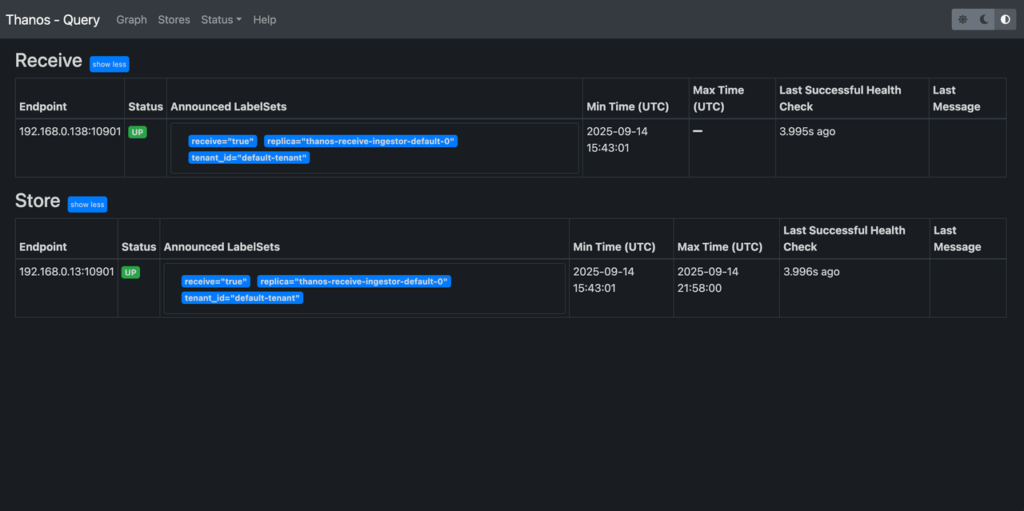
If both appear healthy, the setup is working.
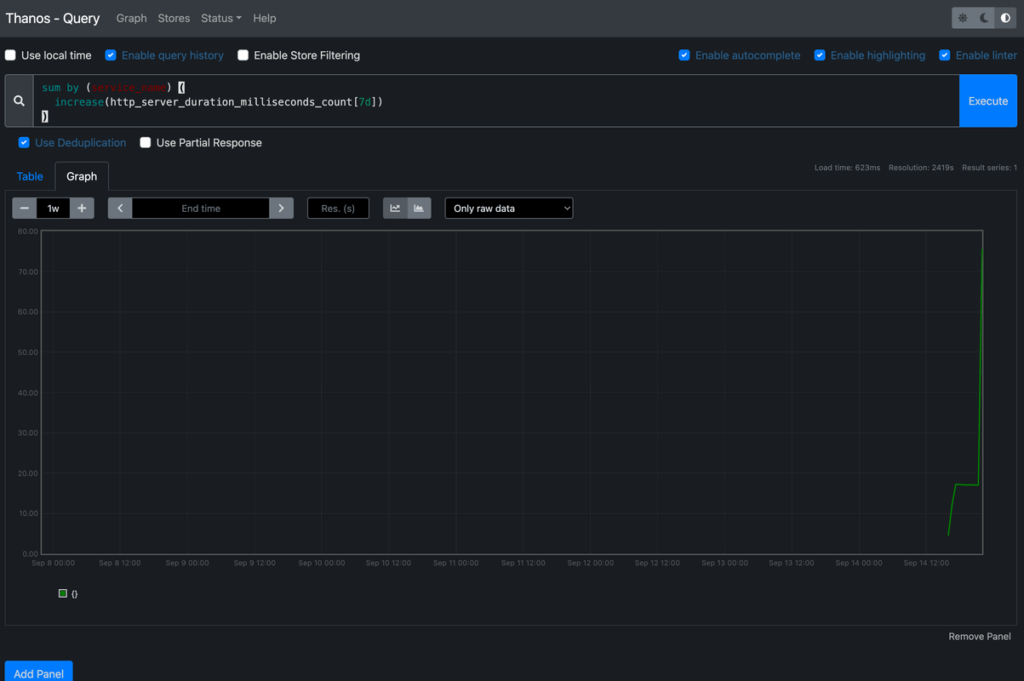
Step 4: Run a PromQL Query
Try out some queries that confirm both recent and historical data:
App-level metric (from your Flask app):
rate(http_server_duration_milliseconds_count[12h])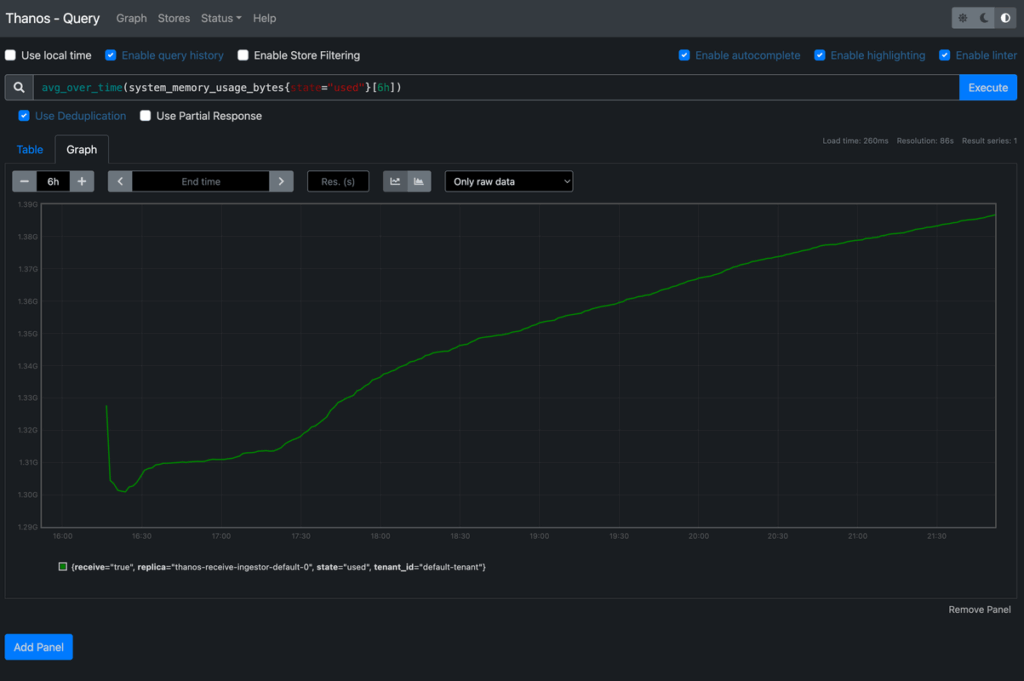
Node/system metric (via hostmetrics):
avg_over_time(system_memory_usage_bytes{state="used"}[6h])Total requests over 7 days (per service):
sum by (service_name) (

  increase(http_server_request_duration_seconds_count[7d])

)
Step 5: Check Store Gateway Sync
Confirm that Store Gateway is fetching blocks from your bucket:
kubectl -n observability logs statefulset/thanos-store
Healthy logs look like:
msg="successfully synchronized block metadata" cached=10 returned=10 partial=0What You’ve Achieved
At this point:
- Short-term metrics flow directly through Prometheus-like semantics via Receive.
- Long-term blocks are stored in UpCloud Object Storage via the ingestors.
- Query federation lets you ask questions across both live and historical data.
- Grafana dashboards can now cover everything from real-time incidents to multi-month trends.
This completes your production-grade observability stack on UpCloud, combining OpenTelemetry with Thanos for cost-efficient, scalable, and durable metrics analysis.
Conclusion
At this stage, you’ve moved from a short-term metrics pipeline into something much more powerful. Your applications now send telemetry over OTLP to the OpenTelemetry Collector, which forwards it directly into Thanos Receive. From there, metrics are shipped into UpCloud Object Storage for long-term retention, and Thanos Query stitches everything together so you can explore both live and historical data through a single PromQL interface. The end result is an observability stack that doesn’t just tell you what’s happening right now, but also lets you look back weeks or months to spot trends, review incidents, and make informed decisions about capacity and performance.
As you continue working with this setup, it’s worth thinking about how to refine it for your needs. Thanos’s multi-tenancy features give you a way to isolate metrics between teams or environments, making governance cleaner and scaling easier. Compaction and downsampling settings are another lever: by tuning them, you can find the right balance between keeping costs manageable and ensuring queries remain fast even as your dataset grows.
With those considerations in mind, you’ve built a system that’s not only functional but also efficient and scalable. It’s a solid foundation for long-term observability on UpCloud, and one that will grow with your workloads.
Discussion