OpenTelemetry gives you a unified, open-source framework for collecting metrics, traces, and logs across your cloud-native infrastructure. In this tutorial, you’ll learn how to deploy a complete OpenTelemetry pipeline on UpCloud Managed Kubernetes from setting up the cluster and deploying the OpenTelemetry Collector, to instrumenting a Python application and verifying telemetry flow into your observability backend.
If you want to understand the why behind OpenTelemetry before jumping into the how, check out our overview guide:
👉 What is OpenTelemetry? Understanding the Standard for Cloud-Native Observability
By the end of this walkthrough, you’ll have a working, vendor-neutral observability setup ready for production built entirely on UpCloud’s fast, reliable infrastructure.
Prerequisites
Before you begin, make sure you have the following tools and access in place:
- Basic Kubernetes knowledge (pods, services, deployments).
- An UpCloud account with access to Managed Kubernetes.
- kubectl and upctl installed locally.
- Python and Docker installed locally.
- (Optional) Access to an observability backend (e.g., Grafana Cloud, Jaeger).
Step 1: Provision and Access Your UpCloud Managed Kubernetes Cluster
The first step is to set up a Kubernetes cluster on UpCloud. This cluster will host both the OpenTelemetry Collector and your instrumented Python application. If you already have a cluster, you can skip to the next section. Otherwise, follow these steps to get started:
Create a Private Network
Before creating your Kubernetes cluster, you’ll need a private network for it to use. This network should have DHCP enabled so that your cluster nodes can automatically receive IP addresses. You can create the network using the UpCloud CLI:
upctl network create --name "monitoring-net" --zone de-fra1 --ip-network address=10.0.1.0/24,dhcp=trueThis command creates a new network named monitoring-net in the de-fra1 zone, with a subnet of 10.0.1.0/24 and DHCP enabled.
Provision the Kubernetes Cluster
With your network in place, you can now create the Kubernetes cluster itself. The following command provisions a new cluster named monitoring-cluster, attaches it to the network you just created, and sets up a node group with three nodes:
upctl k8s create \
  --name monitoring-cluster \
  --network monitoring-net \
  --zone de-fra1 \
  --plan "production-small" \
  --version 1.30 \
  --node-group name=monitoring-nodes,count=3,plan=4xCPU-8GB
Here’s what each flag means:
- –name: The name of your cluster.
- –network: The private network to attach the cluster to.
- –zone: The UpCloud data center region.
- –plan: The control plane size (choose based on your needs).
- –version: The Kubernetes version to deploy.
- –node-group: The name, count, and size of worker nodes.
Provisioning may take a few minutes. Once complete, you can now proceed with the rest of the tutorial.💡 Note: UpCloud’s Managed Kubernetes isn’t free, but pricing is transparent and pay-as-you-go. You can check the latest details here: UpCloud Pricing.
Configure kubectl for Cluster Access
To interact with your new cluster, you’ll need to configure kubectl with the appropriate credentials. You can download the kubeconfig file for the UpCloud cluster via upctl and merge it with your local configuration:
upctl k8s config monitoring-cluster –output yaml –write ~/.kube/config
This command fetches the kubeconfig for your cluster and writes it to your default kubeconfig location, allowing you to use kubectl commands as usual.
Verify Cluster Connectivity
Before moving on, it’s a good idea to verify that your cluster is up and that you can connect to it. Try listing the nodes and namespaces:
kubectl get nodes
kubectl get namespaces
If you see your nodes and the default Kubernetes namespaces, you’re all set!
Step 2: Deploy the OpenTelemetry Collector
With your Kubernetes cluster up and running, the next step is to deploy the OpenTelemetry Collector. The Collector acts as a central point for receiving, processing, and exporting telemetry data (traces, metrics, and logs) from your applications. You’ll use the official Helm chart to simplify the deployment process.
Create a Namespace for Observability
It’s a good practice to keep observability components separate from your application workloads. This makes it easier to manage permissions, apply resource limits, and keep things organized, especially as your cluster grows. Start by creating a dedicated namespace:
kubectl create namespace observability
This command creates a new namespace called observability where you’ll deploy the Collector and any related resources.
Add the OpenTelemetry Helm Repository
Helm makes it easy to install and manage Kubernetes applications. First, add the official OpenTelemetry Helm chart repository and update your local chart list:
helm repo add open-telemetry https://open-telemetry.github.io/opentelemetry-helm-charts
helm repo update
This ensures you have access to the latest version of the OpenTelemetry Collector chart.
Prepare the Collector Configuration
The OpenTelemetry Collector is highly configurable. You’ll need a configuration file (e.g., config.yaml) that defines which receivers, processors, and exporters you want to use. For this tutorial, you can use the following configuration by saving it in a file named config.yaml:
mode: 'deployment'

image:
  repository: "otel/opentelemetry-collector-contrib"

replicaCount: 1

presets:
  # enables the k8sclusterreceiver and adds it to the metrics pipelines
  clusterMetrics:
    enabled: true
  # enables the k8sobjectsreceiver to collect events only and adds it to the logs pipelines
  kubernetesEvents:
    enabled: true

config:
  receivers:
    otlp:
      protocols:
        grpc:
          endpoint: 0.0.0.0:4317
        http:
          endpoint: 0.0.0.0:4318

  exporters:
    debug:
      verbosity: detailed


  extensions:
    health_check:
      endpoint: "0.0.0.0:13133"


  service:
    extensions:
      [
        health_check
      ]
    pipelines:
      traces:
        receivers: [otlp]
        exporters: [debug]
      metrics:
        receivers: [otlp]
        exporters: [debug]
      logs:
        receivers: [otlp]
        exporters: [debug]
Here’s a quick explanation of each of the nodes:
- mode: ‘deployment’: Tells Helm to deploy the Collector as a Kubernetes Deployment.
- image: Specifies the container image to use for the Collector.
- replicaCount: Number of Collector pods to run (usually 1 for a basic setup).
- presets: Enables built-in receivers for Kubernetes cluster metrics and events.
- config.receivers: Defines how the Collector receives telemetry data. Here, OTLP is enabled over both gRPC and HTTP.
- config.exporters: Specifies where the Collector sends data. The debug exporter just logs data for testing.
- config.extensions: Adds a health check endpoint for monitoring the Collector’s health.
- config.service: Ties everything together, defining which receivers and exporters are used for traces, metrics, and logs pipelines.
This example uses the otel/opentelemetry-collector-contrib image, which includes a wide range of receivers, processors, and exporters contributed by the community. This is ideal if you need integrations beyond the official core components.The other option is the otel/opentelemetry-collector image, which contains only the officially supported, stable components. You should use the core image if you want a smaller, more stable footprint and do not require community-contributed features.
Install the Collector Using Helm
Now you’re ready to deploy the Collector. Use the following command to install it in your cluster using the configuration file you saved above:
helm install otel-collector-cluster open-telemetry/opentelemetry-collector -n observability --values config.yamlHelm will create the necessary Kubernetes resources (Deployment, Service, ConfigMap, etc.) for the Collector.
Verify the Collector Deployment
After a minute or two, check that the Collector pod is running using the following command:
kubectl get pods -n observability
You should see a pod with a name like otel-collector-cluster-… in the Running state. If it’s not in the running state, use kubectl describe pod <pod-name> -n observability to troubleshoot.
At this point, your OpenTelemetry Collector is live and ready to receive telemetry data from your applications!
Step 3: Instrument the Python Application
Now that your OpenTelemetry Collector is running, let’s instrument a Python application to generate and export telemetry data (traces, metrics, and logs).
Creating the Python App
Below is the code for a simple Flask app instrumented with OpenTelemetry:
from flask import Flask
import logging
from opentelemetry import trace

app = Flask(__name__)

tracer = trace.get_tracer_provider().get_tracer(__name__)

@app.route("/")
def hello():
    with tracer.start_as_current_span("foo"):

        current_span = trace.get_current_span()
        current_span.add_event("This is a span event")

        logging.getLogger().error("Saying hello from the root endpoint!")
        return "Hello from OpenTelemetry!"

if __name__ == "__main__":
    app.run(host="0.0.0.0", port=5000)
This Python application is a simple Flask web server instrumented with OpenTelemetry for tracing and logging.
It starts by importing Flask for handling HTTP requests, Python’s built-in logging module, and the OpenTelemetry tracing API. The app instance is created, and a tracer is obtained from the OpenTelemetry provider. The root endpoint (/) is defined to start a new trace span named “foo” for each incoming request. Within this span, a custom event is added to provide additional context in the trace.
The application also emits a log message using Python’s standard logger. Thanks to OpenTelemetry’s zero-code (automatic) instrumentation for logging, simply using the logger is enough for these logs to be captured and exported—no extra code is needed for log integration. You can then use opentelemetry-instrument to run the app and set up auto-instrumentation.
Once the app is ready, you will need to containerize it. Here’s the Dockerfile you will need to create the container image:
FROM python:3.13-slim

WORKDIR /app
COPY . .

ENV OTEL_PYTHON_LOGGING_AUTO_INSTRUMENTATION_ENABLED=true

RUN pip install \
    flask \
    opentelemetry-instrumentation-flask \
    opentelemetry-distro \
    opentelemetry-exporter-otlp

RUN opentelemetry-bootstrap --action=install

CMD ["sh", "-c", "opentelemetry-instrument --traces_exporter console,otlp  --metrics_exporter console,otlp   --logs_exporter console,otlp flask run --host=0.0.0.0"]
This image uses the slim Python 3.13 base image. It first sets the working directory and copies the app code into it. Then, it enables auto-instrumentation for logging using the OTEL_PYTHON_LOGGING_AUTO_INSTRUMENTATION_ENABLED environment variable. This is necessary if you are using zero-code instrumentation.
Next up, it installs Flask and OpenTelemetry packages for Flask, the OTel distribution, and the OTLP exporter. Then, it installs any additional dependencies required for auto-instrumentation via the opentelemetry-bootstrap command. Finally, it runs the app using opentelemetry-instrument, which automatically instruments supported libraries and exports traces, metrics, and logs to both the console and OTLP endpoints.
You’ll now need to build the Docker image and push it to a container registry like Docker Hub. To build the image, run the following command, replacing <your-dockerhub-username> with your actual Docker Hub username:
docker build -t <your-dockerhub-username>/otel-python-app:latest .
If you are using an ARM architecture machine (such as a Mac with an Apple Silicon chip), you will need to use Docker Buildx to ensure that the Docker image is built for linux/amd64, not ARM:
docker buildx build --platform linux/amd64 -t <your-dockerhub-username>/otel-python-app:latest.Once the image is built, push it to Docker Hub so it can be accessed by your Kubernetes cluster:
docker push <your-dockerhub-username>/otel-python-app:latestKubernetes Deployment and Service
Here’s the Kubernetes manifest (python-app.yaml) to deploy your instrumented app:
apiVersion: apps/v1
kind: Deployment
metadata:
  name: python-app
spec:
  replicas: 1
  selector:
    matchLabels:
      app: python-app
  template:
    metadata:
      labels:
        app: python-app
    spec:
      containers:
        - name: python-app
          image: <your-docker-hub-username>/otel-python-app:latest
          ports:
            - containerPort: 5000
          env:
            - name: OTEL_SERVICE_NAME
              value: "python-app"
            - name: OTEL_EXPORTER_OTLP_PROTOCOL
              value: "http/protobuf"
            - name: OTEL_EXPORTER_OTLP_ENDPOINT
              value: "http://otel-collector-cluster-opentelemetry-collector.observability.svc.cluster.local:4318"
            - name: OTEL_METRICS_EXPORTER
              value: "otlp"
            - name: OTEL_TRACES_EXPORTER
              value: "otlp"
            - name: OTEL_LOGS_EXPORTER
              value: "otlp"
            - name: OTEL_RESOURCE_ATTRIBUTES
              value: "service.name=my-app,service.namespace=default,deployment.environment=production"
---
apiVersion: v1
kind: Service
metadata:
  name: python-app
spec:
  selector:
    app: python-app
  ports:
    - protocol: TCP
      port: 80
      targetPort: 5000
Explanation:
This Kubernetes manifest defines a deployment and a service resource for the instrumented Python application.
The deployment specifies the container image and a set of environment variables that are essential for OpenTelemetry auto-instrumentation and for connecting to the OpenTelemetry Collector. These environment variables configure how the app exports telemetry data:
- OTEL_SERVICE_NAME sets the logical name for the service, which will appear in your observability backend.
- OTEL_EXPORTER_OTLP_PROTOCOL specifies the protocol used for exporting telemetry data; here, it is set to http/protobuf for compatibility with the Collector.
- OTEL_EXPORTER_OTLP_ENDPOINT provides the URL of the OpenTelemetry Collector’s OTLP HTTP endpoint, so the app knows where to send its traces, metrics, and logs.
- OTEL_METRICS_EXPORTER, OTEL_TRACES_EXPORTER, and OTEL_LOGS_EXPORTER enable exporting all three types of telemetry data (metrics, traces, and logs) using the OTLP protocol.
OTEL_RESOURCE_ATTRIBUTES attaches additional metadata to all telemetry data, such as the service name, namespace, and deployment environment, which helps with filtering and grouping in observability tools.
Apply the manifest to your cluster using:
kubectl apply -f python-app.yaml
This will create the deployment and service resources in the default namespace of your cluster.
Step 4: Test Telemetry and Visualize Data
With your instrumented Python application running in the cluster and the OpenTelemetry Collector deployed, it’s time to confirm that telemetry data is flowing as expected.
Check the Collector Pod Logs
The simplest way to validate that your app is sending telemetry data is to inspect the logs of the OpenTelemetry Collector pod. Since the sample configuration uses the debug exporter, all received telemetry will be printed to the Collector’s logs.
First, get the name of the Collector pod:
kubectl get pods -n observability
Then, retrieve the logs for the pod (replace <otel-collector-pod-name> with the actual pod name):
kubectl logs -n observability <otel-collector-pod-name>
You can try searching for “This is a span event” in the logs:
You can also try looking up the log “Saying hello from the root endpoint!”:
This confirms that you have set up the Collector and instrumented your application perfectly!
[Optional] Step 5: Visualize in an Observability Backend
To take things a step further, you can consider configuring the Collector to export data to an observability backend (such as Grafana Cloud, Jaeger, or another supported system) to be able to view your service’s traces, metrics, and logs conveniently.
For example, you can create a new Grafana Cloud account (if you don’t already have one) and follow this guide to set up your OpenTelemetry Collector as a data source.
Here’s a lean OpenTelemetry Helm Chart values file to help you get started quickly:
mode: 'deployment'

image:
  repository: "otel/opentelemetry-collector-contrib"

replicaCount: 1

presets:
  # enables the k8sclusterreceiver and adds it to the metrics pipelines
  clusterMetrics:
    enabled: true
  # enables the k8sobjectsreceiver to collect events only and adds it to the logs pipelines
  kubernetesEvents:
    enabled: true

config:
  receivers:
    otlp:
      protocols:
        grpc:
          endpoint: 0.0.0.0:4317
        http:
          endpoint: 0.0.0.0:4318

  exporters:
    debug:
      verbosity: detailed
    otlphttp/grafana_cloud:
      endpoint: "[GRAFANA_CLOUD_OTLP_ENDPOINT]"
      auth:
        authenticator: basicauth/grafana_cloud

  extensions:
    health_check:
      endpoint: "0.0.0.0:13133"
    basicauth/grafana_cloud:
      client_auth:
        username: "[GRAFANA_CLOUD_INSTANCE_ID]"
        password: "[GRAFANA_CLOUD_API_KEY]"

  connectors:
    grafanacloud:
      host_identifiers: ["host.name"]

  service:
    extensions:
      [
        basicauth/grafana_cloud,
        health_check
      ]
    pipelines:
      traces:
        receivers: [otlp]
        exporters: [debug, otlphttp/grafana_cloud, grafanacloud]
      metrics:
        receivers: [otlp]
        exporters: [debug, otlphttp/grafana_cloud]
      metrics/grafanacloud:
        receivers: [grafanacloud]
        exporters: [otlphttp/grafana_cloud]
      logs:
        receivers: [otlp]
        exporters: [debug, otlphttp/grafana_cloud]
In this configuration file, exporters are configured to forward telemetry to Grafana Cloud using OTLP over HTTP, with authentication handled by a basic auth extension. Additionally, a health check extension exposes a status endpoint for monitoring the Collector itself. Finally, the file defines pipelines for traces, metrics, and logs so that all three signal types are captured and exported appropriately.
Just make sure to replace GRAFANA_CLOUD_OTLP_ENDPOINT, GRAFANA_CLOUD_INSTANCE_ID, and GRAFANA_CLOUD_API_KEY with their correct values from your Grafana Cloud account.
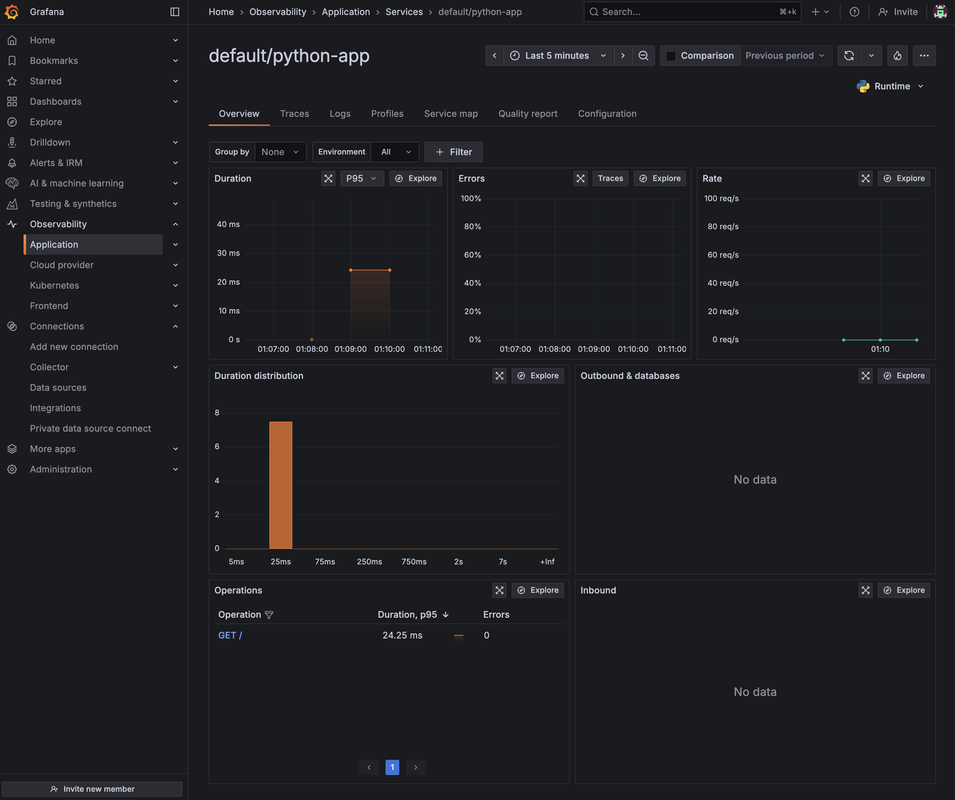
Once the OpenTelemetry Collector installation is updated, you can try generating new logs and traces by sending GET requests to your app and wait for 2-3 minutes for Grafana Cloud to receive the telemetry data from your Collector. Then, you should be able to search for your service name (e.g., python-app) and see the telemetry data generated by your application.
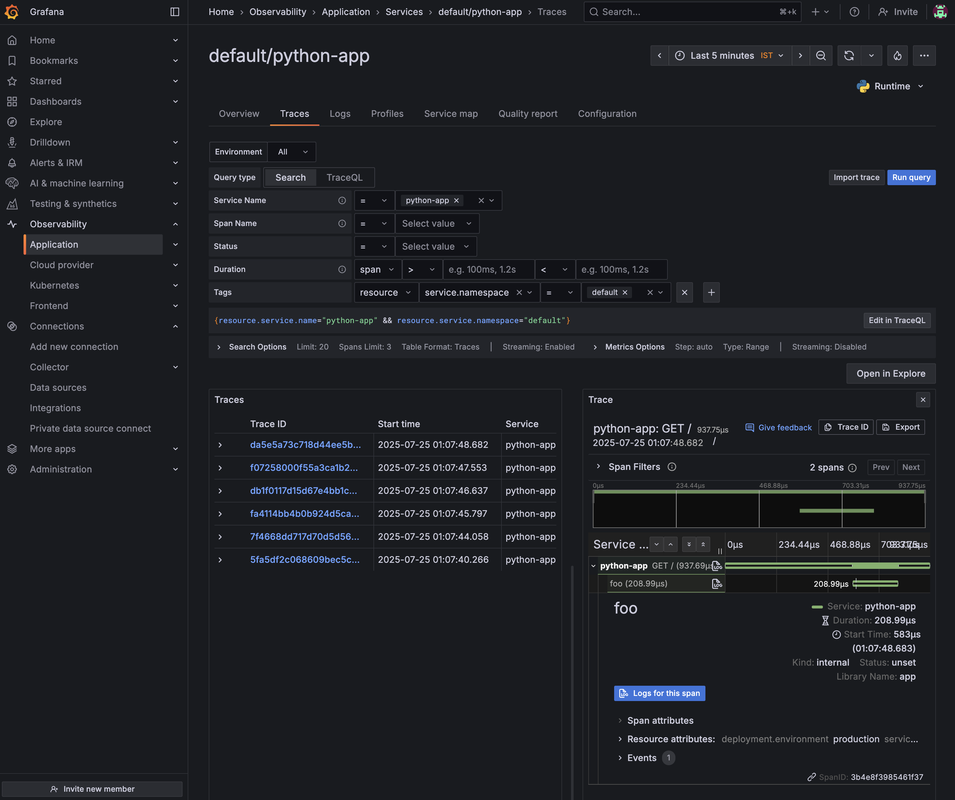
In the traces tab, you can see individual traces generated by your app along with its associated events:
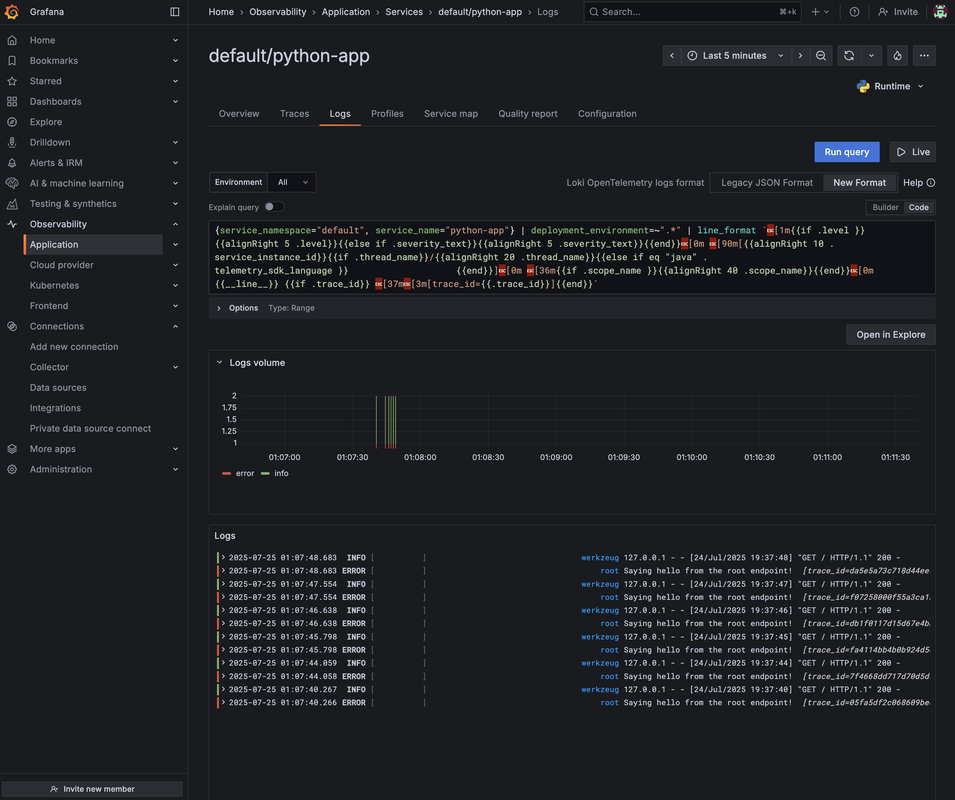
You can also explore the logs associated with each trace in detail:
If you don’t see telemetry data, you can try out a few things, such as:
- Double-check the environment variables in your deployment manifest.
- Ensure the Collector pod is running and healthy.
- Look for errors in the Collector and application pod logs.
- Verify network connectivity between your app and the Collector (the OTLP endpoint).
Once you’ve confirmed that telemetry is flowing, you’ve successfully set up end-to-end observability for your Python app on UpCloud Kubernetes!
Conclusion
In this tutorial, you set up a full OpenTelemetry observability pipeline on UpCloud Managed Kubernetes. You provisioned a Kubernetes cluster, deployed the OpenTelemetry Collector, instrumented a Python application with support for traces, metrics, and logs, and verified that telemetry data was flowing correctly. You also learned how to preview this data using the debug exporter or a connected observability backend like Grafana Cloud.
By default, the OpenTelemetry Collector does not retain telemetry data. It simply receives, processes, and forwards it. When using the debug exporter, data is only visible in the Collector’s logs and disappears after processing. Similarly, Grafana Cloud provides short-term retention: trace data is typically retained for 3 days on the free tier, while metrics are kept for 14 days, and logs vary based on plan.
For many teams, especially those operating in production environments, this short-term visibility is not enough. Long-term storage is essential for historical analysis, capacity planning, compliance, and post-incident reviews.That’s exactly what Part 2 of this series will cover: how to integrate Thanos with your OpenTelemetry pipeline to enable cost-effective long-term metrics storage and scalable querying. Stay tuned!
Discussion