After setting up Prometheus in Part 1 on a dedicated UpCloud Managed Kubernetes cluster, with support for both Kubernetes-native workloads and external VMs, you now have a flexible monitoring foundation in place. But collecting metrics is only as good as the visibility it provides. To truly understand what’s happening on your virtual machines, you’ll need host-level metrics like CPU usage, memory availability, and disk I/O.
That’s where Node Exporter comes in. Node Exporter is the standard Prometheus exporter for gathering detailed system metrics from Linux servers. It runs as a lightweight daemon on each VM and exposes resource usage statistics on port 9100.
In this article, you’ll learn how to install Node Exporter on UpCloud Cloud Servers, configure Prometheus to scrape these metrics, and write PromQL queries to analyze performance. By the end, you’ll have a monitoring setup that gives you real-time insight into both your Kubernetes cluster and the underlying VM infrastructure.
Installing Node Exporter on UpCloud Cloud Server
To collect host-level metrics like CPU, memory, and disk usage from your Cloud Server, you’ll install and run the Node Exporter on each server. Node Exporter is a lightweight and efficient agent designed specifically for Prometheus, and it works on most Linux distributions.
Prerequisites
Before getting started, make sure you have:
- One or more UpCloud Cloud Servers running a supported OS (e.g., Ubuntu, Debian, RHEL, or CentOS).
- SSH access to each server.
- Prometheus running in your Kubernetes cluster.
You can create a new Cloud Server quickly using upctl by running the following command:
upctl server create \
  --title "Target Server 1" \
  --zone sg-sin1 \
  --os "AlmaLinux 9" \
  --hostname targetserver1 \
  --ssh-keys key.pub \
  --plan DEV-1xCPU-1GB-10GB
Step 1: Download and Install Node Exporter
To start off, SSH into your Cloud Server:
ssh <user>@<your-server-ip>Then, create a new system user account for your node exporter service (which you will create later):
sudo useradd --system --shell /bin/false node_exporterNext, you need to download and install the latest Node Exporter release. To do that, you will first need to install tar, the command line utility for managing archives:
sudo dnf install tar -yNext, set the version of Node Exporter to download and install:
NODE_EXPORTER_VERSION="1.8.1"Finally, use curl to download the zipped binary, tar to decompress it and move it to /user/local/bin, and chown to provide the user you created earlier with the permissions to execute the binary:
curl -fsSL https://github.com/prometheus/node_exporter/releases/download/v${NODE_EXPORTER_VERSION}/node_exporter-${NODE_EXPORTER_VERSION}.linux-amd64.tar.gz \
| sudo tar -zxvf - -C /usr/local/bin --strip-components=1 node_exporter-${NODE_EXPORTER_VERSION}.linux-amd64/node_exporter \
&& sudo chown node_exporter:node_exporter /usr/local/bin/node_exporter
Step 2: Set It up as a systemd Service
Next, create a systemd service file by running the following command:
sudo tee /etc/systemd/system/node_exporter.service > /dev/null <<EOF
[Unit]
Description=Node Exporter

[Service]
User=node_exporter
Group=node_exporter
ExecStart=/usr/local/bin/node_exporter

[Install]
WantedBy=multi-user.target
EOF
This file defines the executable file path and the allowed users for the service. Reload the daemon and start the service by running the following commands:
sudo systemctl daemon-reload
sudo systemctl start node_exporter
You can check the status of the running service with the following command:
sudo systemctl status node_exporterFinally, set up the service to start on boot:
sudo systemctl enable node_exporterNode Exporter should now be running and listening for HTTP requests on port 9100.
Updating Prometheus Configuration to Scrape Node Exporter
Now that Node Exporter is installed and running on at least one of your UpCloud Cloud Servers, it’s time to configure Prometheus to start collecting metrics from them. In Part 1, you saw how to use a static list of target exporters in the values.yaml file of your kube-prometheus-stack deployment to scrape data from servers. In this part, you will see a dynamic, file-based service discovery system.
Step 1: Create the Targets File
First of all, you need to create a list of target IPs that you want your Prometheus operator to scrape data from. To do that, you will need to use the Kubernetes ConfigMap resource. Create a new file named targets-list.yaml and save the following contents in it:
apiVersion: v1
kind: ConfigMap
metadata:
  name: scrape-file-sd-targets
  namespace: monitoring
  labels:
    prometheus: vm-monitoring
data:
  targets.yaml: |
    - labels:
        job: node-demo
      targets:
      - "<public ip>:9100"
Make sure to replace the <public ip> placeholder with the public IPv4 IP of your Cloud Server. Also, please feel free to set the metadata labels for each of your targets here as you wish. These labels will be attached to all scraped metrics from the target and will help categorize and filter your metrics later.
Once done, run the following command to create the config map on your Kubernetes cluster:
kubectl apply -f targets-list.yamlStep 2: Create a Prometheus ScrapeConfig
The Kubernetes Prometheus Operator ships with the ScrapeConfig CRD that is meant to make it convenient to scrape targets external to the Kubernetes cluster. You will need to create one that collects the list of targets from your configmap and configures the Prometheus operator to scrape them.
To do that, create a new file named scrapeconfig.yaml and save the following contents in it:
apiVersion: monitoring.coreos.com/v1alpha1
kind: ScrapeConfig
metadata:
  name: file-sd
  namespace: monitoring
  labels:
    prometheus: vm-monitoring
    app.kubernetes.io/name: file-sd-scrape-config
spec:
  fileSDConfigs:
    - files:
        - /etc/prometheus/configmaps/scrape-file-sd-targets/targets.yaml
Here, you can use one of spec.static_config, spec.fileSDConfigs, and spec.httpSDConfigs to configure the method of providing the targets’ information. For file-based discovery, you need to use spec.fileSDConfigs and specify the files to be used for discovering external services.
Once you’ve saved this file, create the ScrapeConfig resource in your cluster by running the following command:
kubectl apply -f scrapeconfig.yamlStep 3: Update the Helm Installation Values
In the values.yaml file for your Helm kube-prometheus-stack, you now need to specify the scrapeConfigSelector to specify the ScrapeConfig objects to be used by the Prometheus operator, along with the config maps that need to be mounted on it. To do that, update the values.yaml file to the following:
prometheus:
  prometheusSpec:
    serviceMonitorSelectorNilUsesHelmValues: false
    ruleSelectorNilUsesHelmValues: false
    scrapeConfigSelector:
      matchLabels:
        prometheus: vm-monitoring
    configMaps:
      - scrape-file-sd-targets
Once done, run the helm upgrade command to update the installation with the new values.yaml file:
helm upgrade prometheus-stack prometheus-community/kube-prometheus-stack \
  --namespace monitoring \
  -f values.yaml
That’s it! You should now be able to visit the /targets endpoint on your Prometheus server, and the new target should show on the targets list:
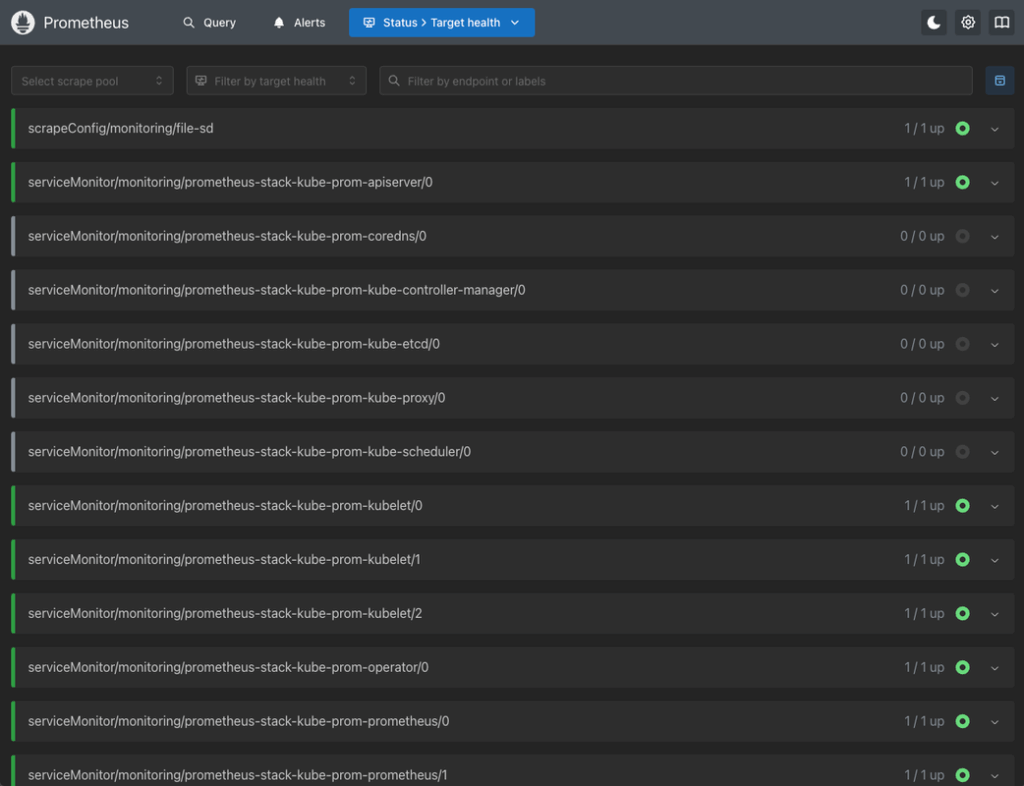
This means that you have set it up correctly. In the next section, you’ll learn how to use Prometheus to explore these new metrics via the web UI and PromQL.
Querying Metrics via Prometheus UI or API
With Node Exporter running on your UpCloud Cloud Servers and Prometheus configured to scrape their metrics, you can now start exploring system performance using PromQL, the query language built into Prometheus.
Accessing the Prometheus Web Interface
If you haven’t set up an Ingress yet, you can access Prometheus locally using kubectl port-forward:
kubectl port-forward svc/prometheus-stack-kube-prometheus-prometheus 9090 -n monitoringThen open your browser to: http://localhost:9090.
Try Sample PromQL Queries
Head to the “Graph” tab or the “Expression” input under “Targets”. Here are a few useful queries to try:
1. Check Node Exporter Targets
up{job="node-demo"}This returns the current status of all Node Exporter targets. Each result should show value = 1 if the target is up and scraping successfully:
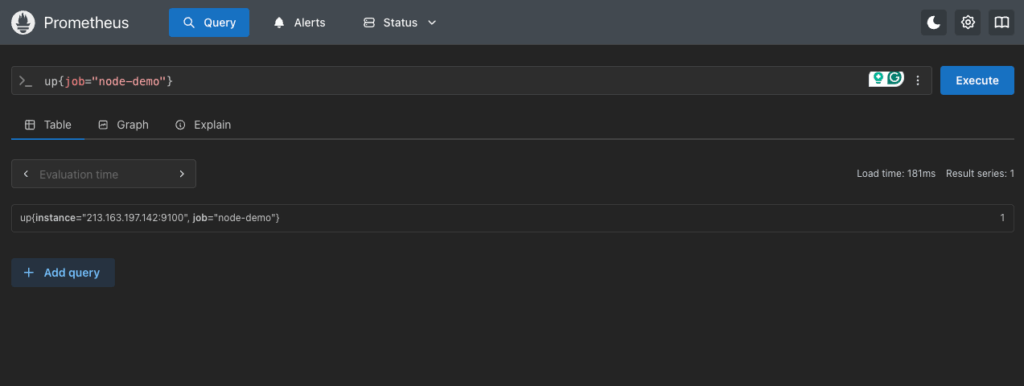
2. CPU Usage by Mode
rate(node_cpu_seconds_total{mode!="idle", job="node-demo"}[5m])This query shows the CPU usage rate (per mode) across all scraped servers, excluding idle time:
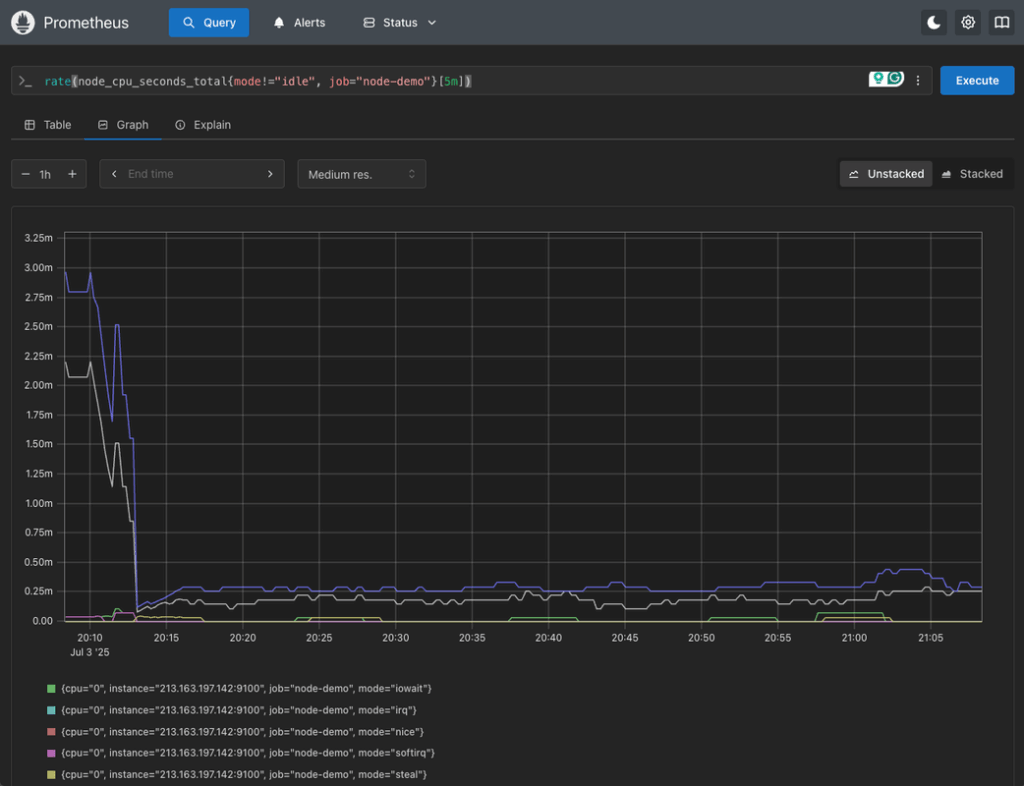
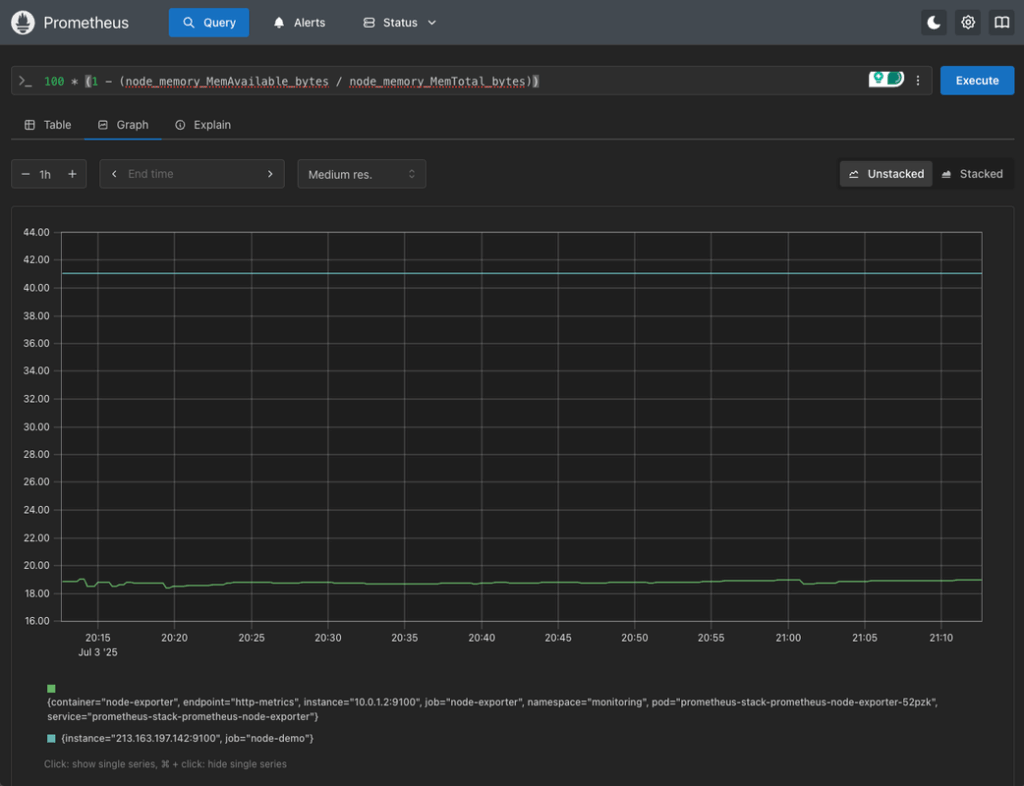
3. Memory Usage Percentage
(1 - (node_memory_MemAvailable_bytes / node_memory_MemTotal_bytes)) * 100This query gives you a live percentage of memory used on each Cloud Server.

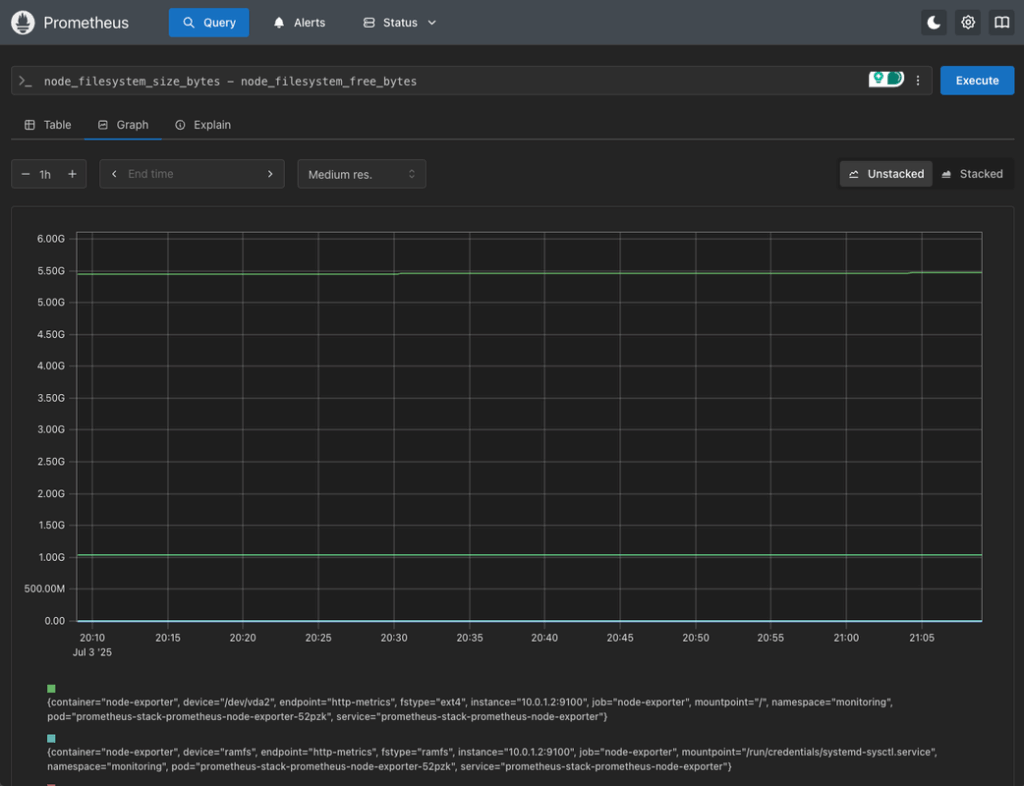
4. Disk Usage
node_filesystem_size_bytes - node_filesystem_free_bytesThis query shows raw disk usage per filesystem, which can be filtered further by device or mount point.
Optional: Query via the HTTP API
Prometheus also exposes a REST API you can use to programmatically fetch metrics. You can use it by appending your PromQL query as the value of the query parameter query in the /api/v1/query endpoint of your Prometheus server. For example:
➜  upcloud-prometheus curl http://localhost:9090/api/v1/query\?query\=up%7Bjob\=%27node-demo%27%7D
{"status":"success","data":{"resultType":"vector","result":[{"metric":{"__name__":"up","instance":"213.163.197.142:9100","job":"node-demo"},"value":[1751576969.348,"1"]}]}}
This is useful if you want to integrate metrics into external tools or trigger automated responses based on system health.
Using Metrics to Monitor CPU and Memory Usage
Once Prometheus is successfully collecting metrics from Node Exporter, you can start turning that data into meaningful insights. These host-level metrics help you detect bottlenecks, track system performance over time, and respond to issues before they become outages.
Monitor CPU Load
CPU metrics from Node Exporter show how your Cloud Server processors are being used across different modes: user, system, idle, etc.
For example, to get a quick view of CPU load over time, you can try the CPU usage query you saw earlier:
rate(node_cpu_seconds_total{mode!="idle", job="node-demo"}[5m])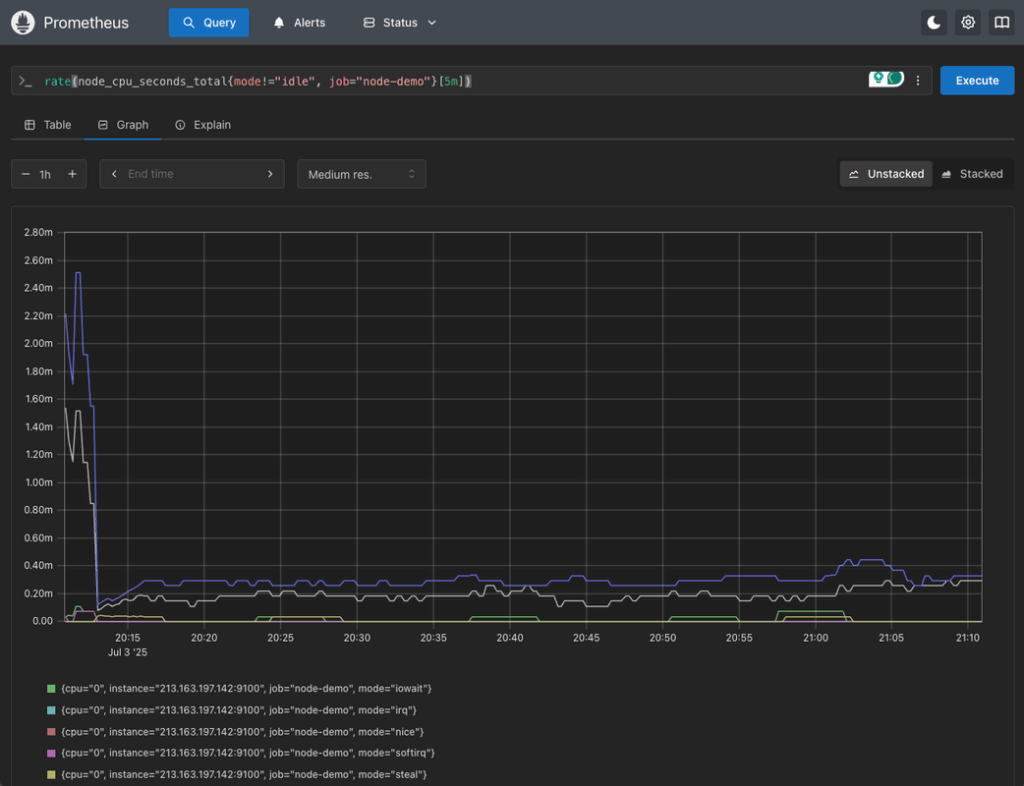
This shows how much time (per second) the CPUs spend doing non-idle work, averaged over 5 minutes.
To simplify this into a single metric for alerting or dashboarding, try doing an average by instance type:
avg(rate(node_cpu_seconds_total{mode!="idle", job="node-demo"}[5m])) by (instance)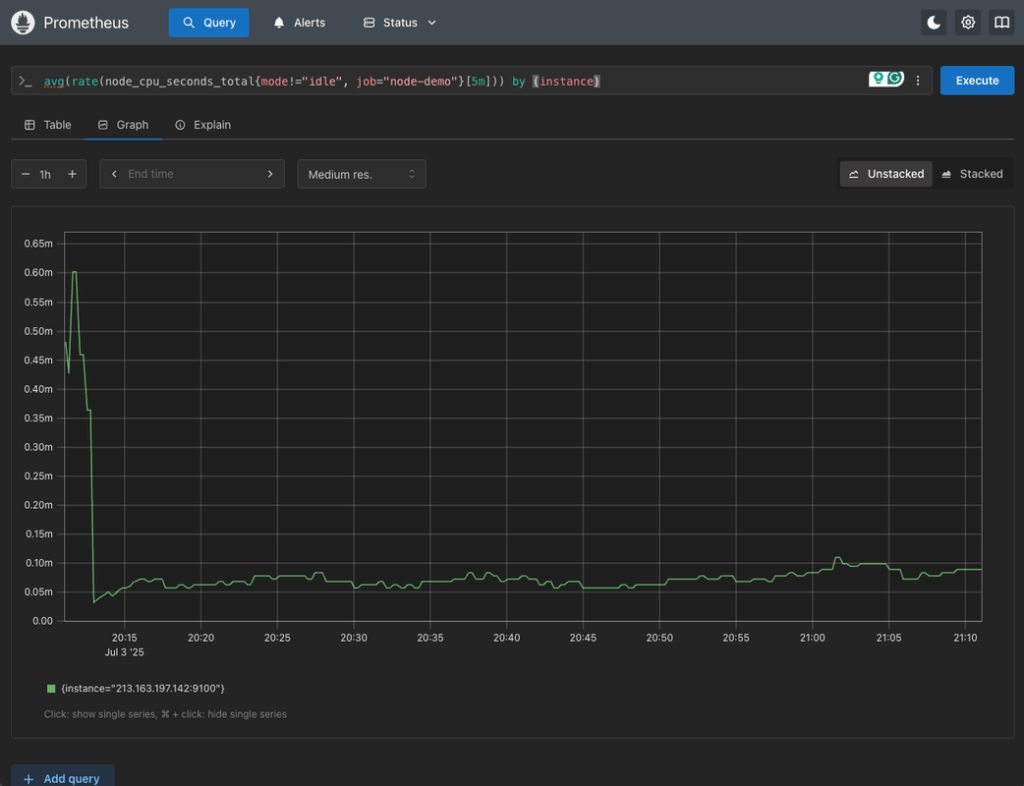
This gives average CPU usage per Cloud Server instance, which can be a good way to detect overutilized servers.
Monitor Memory Usage
Node Exporter also exposes detailed memory stats. For a high-level usage percentage, you already saw a query before:
100 * (1 - (node_memory_MemAvailable_bytes / node_memory_MemTotal_bytes))This gives you memory usage as a percentage, which you can filter by instance, environment, or any label you added in your targets file.
Monitor Disk Usage
Disk space problems are often missed until they’re critical. To check usage, you used this query before:
node_filesystem_size_bytes - node_filesystem_free_bytes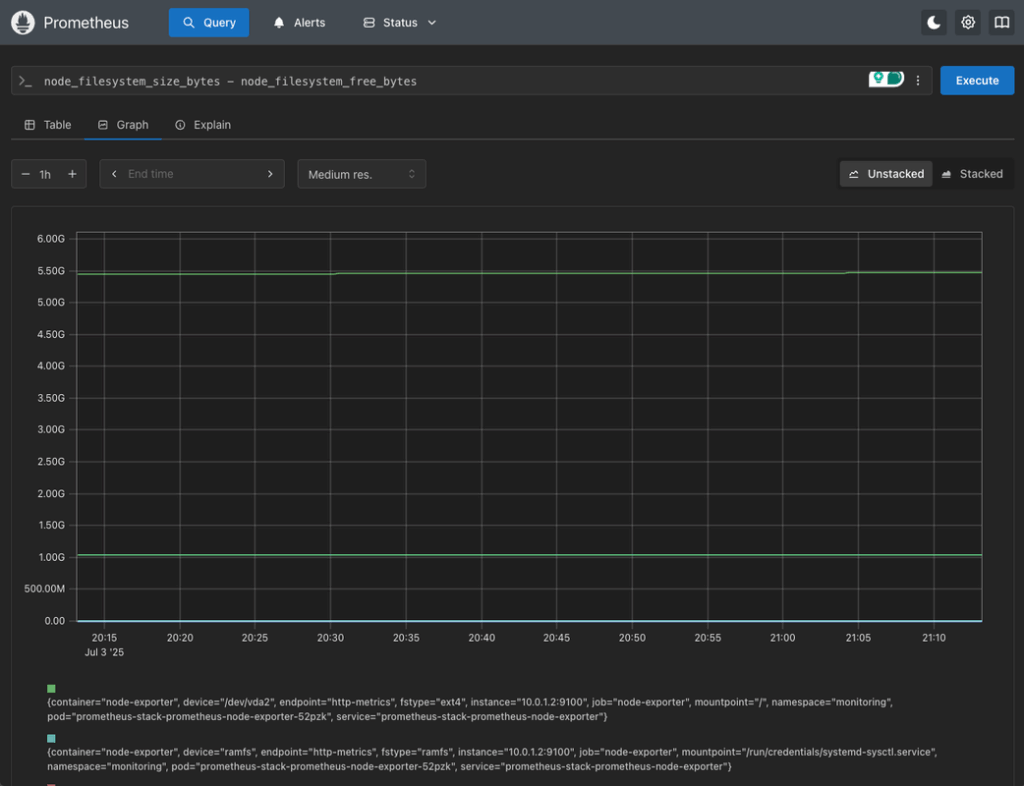
To express it as a percentage, you can run the following:
100 * (1 - (node_filesystem_free_bytes / node_filesystem_size_bytes))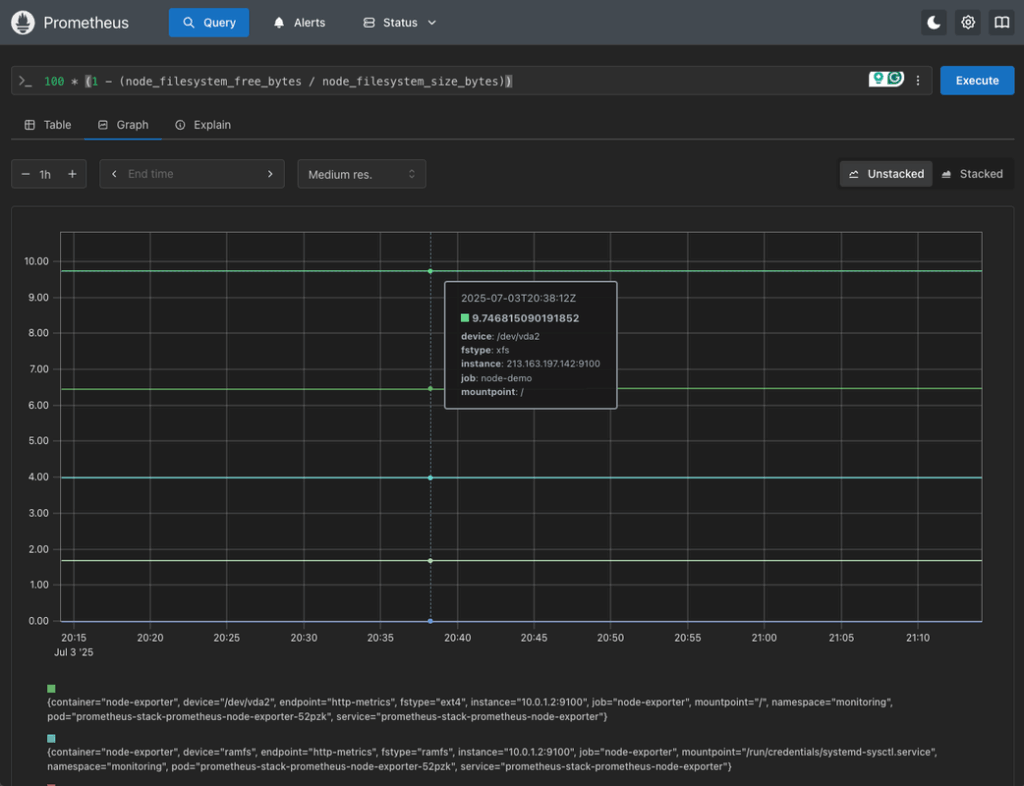
You can filter by mountpoint or device if needed.
Set Up Basic Alerts (Optional for Now)
While full alerting configuration will be covered in a later part of this series, it’s worth thinking about thresholds now. For example:
- CPU usage > 80% over 10 minutes
- Memory usage > 90%
- Disk usage > 85%
You can configure alerts on these later in Prometheus or Alertmanager to notify your team via email, Slack, or other channels.
Conclusion
In this second part of the series, you’ve extended your Prometheus-based monitoring setup on UpCloud to include detailed, host-level visibility into your virtual machines using Node Exporter. By installing Node Exporter on each Cloud Server, configuring Prometheus to scrape its metrics using file-based service discovery, and querying those metrics via PromQL, you’ve gained real-time insights into CPU load, memory availability, and disk usage across your infrastructure.
The key advantage of this setup is unification. The setup allows you to use a single Prometheus instance to monitor both your Kubernetes workloads and traditional server-based services. This eliminates silos, simplifies alerting, and prepares your monitoring system for growth as your architecture evolves.
In Part 3, we’ll integrate Grafana with your Prometheus deployment to create beautiful, actionable dashboards. You’ll also learn how to import ready-made dashboards for Node Exporter, customize visualizations, and begin building a visual monitoring layer that works across environments.
Discussion