In the first two parts of this series, we walked through setting up Prometheus on an UpCloud-managed Kubernetes cluster and began collecting metrics from both the cluster and external VMs using Node Exporter. With Prometheus scraping metrics effectively, the next logical step is turning that raw data into meaningful visual insights. That’s where Grafana comes in.
Grafana is a powerful, open-source visualization tool purpose-built for time-series data like the metrics collected by Prometheus. It allows you to build real-time dashboards, set alerts, and gain visibility into your infrastructure without writing custom UI code.
In this third part, you’ll learn how to integrate Grafana into your existing Prometheus setup on UpCloud. We’ll walk through installing Grafana using Helm, connecting it to Prometheus, and exposing the Grafana UI so you can start exploring your data. You’ll also learn how to import pre-built dashboards specifically designed for Node Exporter metrics, giving you instant insight into CPU usage, memory consumption, disk I/O, and network traffic across your servers.
We’ll also cover data retention settings and show you how to build your own dashboards using PromQL. By the end of this article, you’ll have a fully functional monitoring and visualization stack ready to diagnose and optimize your infrastructure in real time.
Installing Grafana on the Monitoring Cluster
Grafana can be deployed alongside Prometheus using the same Helm chart, kube-prometheus-stack, which bundles Prometheus, Grafana, Alertmanager, and related tooling into a single package. If you’ve already installed this stack, Grafana may already be included by default. If not, you can enable it during installation or enable it later via a Helm upgrade.
Here’s what you will need to follow along:
- A working Kubernetes cluster on UpCloud with kube-prometheus-stack installed.
- Helm installed and configured to communicate with your cluster.
- kubectl access to the cluster.
Step 1: Install or Upgrade kube-prometheus-stack With Grafana Enabled
If installing fresh:
helm repo add prometheus-community https://prometheus-community.github.io/helm-charts
helm repo update

helm install prometheus-stack prometheus-community/kube-prometheus-stack \
  --namespace monitoring \
  --create-namespace \
  --set grafana.enabled=true
If Grafana was previously disabled and you want to enable it now:
helm upgrade prometheus-stack prometheus-community/kube-prometheus-stack \
  --namespace monitoring \
  --set grafana.enabled=true
Step 2: Expose Grafana
To access Grafana’s web interface, you need to expose the service. UpCloud Managed Kubernetes provides excellent support for both LoadBalancer and Ingress methods:
Option A: LoadBalancer (Recommended for UpCloud)
UpCloud automatically provisions load balancers for LoadBalancer services, making this the simplest option.
All you need to do is patch the Grafana service to use LoadBalancer:
kubectl patch svc prometheus-stack-grafana \
 -n monitoring \
 -p '{"spec": {"type": "LoadBalancer"}}'
UpCloud will automatically provision a load balancer and assign an external IP (typically takes 1-2 minutes). You can check the service status and get the external IP using the following command:
kubectl get svc -n monitoring prometheus-stack-grafana

NAME                       TYPE           CLUSTER-IP     EXTERNAL-IP                                           PORT(S)        AGE
prometheus-stack-grafana   LoadBalancer   10.96.131.69   lb-0a49baafccad4bc0b3cd762a19727786-1.upcloudlb.com   80:31728/TCP   3m42s
Once available, access Grafana at http://<EXTERNAL-IP>.
Note: UpCloud LoadBalancer services incur additional costs based on the UpCloud Load Balancer pricing.
Option B: Ingress with UpCloud Load Balancer
For production setups with custom domains, UpCloud supports NGINX Ingress Controller. However, you’ll need to set up NGINX Ingress Controller (can be installed via UpCloud’s add-ons or manually) and configure your custom domain name to point to your ingress controller’s LoadBalancer IP.
You can deploy NGINX Ingress Controller using the following command:
helm repo add ingress-nginx https://kubernetes.github.io/ingress-nginx
helm install ingress-nginx ingress-nginx/ingress-nginx \
 --namespace ingress-nginx \
 --create-namespace \
 --set controller.service.type=LoadBalancer
Now, you can create a new ingress resource to set up routing so that the Grafana app is exposed on a subdomain of your choice, such as grafana.yourdomain.com. To do that, save the following in a file named grafana-ingres.yaml:
apiVersion: networking.k8s.io/v1
kind: Ingress
metadata:
 name: grafana-ingress
 namespace: monitoring
 annotations:
   nginx.ingress.kubernetes.io/rewrite-target: /
spec:
 ingressClassName: nginx
 rules:
 - host: grafana.yourdomain.com
   http:
     paths:
     - path: /
       pathType: Prefix
       backend:
         service:
           name: prometheus-stack-grafana
           port:
             number: 80
Make sure to replace grafana.yourdomain.com with the right subdomain for your case. Once done, apply the ingress resource to your cluster:
kubectl apply -f grafana-ingress.yamlOnce the ingress resource is deployed, you can check if it has received the external IP address by running the following command:
kubectl get ingress -n monitoring grafana-ingress

NAME              CLASS    HOSTS   ADDRESS                                               PORTS   AGE
grafana-ingress   <none>   *       lb-0ab93ded31204f26b2e6d78985856604-1.upcloudlb.com   80      97s
Once it receives an external IP, you will need to configure a CNAME record in your custom domain’s DNS to point to the IP, like this:
name.domain.tld. IN CNAME 60 <ingress-nginx-loadbalancer-external-ip>Now, you will be able to access Grafana at https://grafana.yourdomain.com.
For TLS: Use cert-manager with Let’s Encrypt for automatic certificate management on UpCloud.
Option C: Port Forwarding (Testing Only)
For quick local testing without exposing the service, you can run the following command:
kubectl port-forward svc/prometheus-stack-grafana 3000:80 -n monitoringAccess Grafana at http://localhost:3000. This method only works while the command is running.
Connecting Prometheus as a Data Source
Once Grafana is up and running, the next step is to connect it to Prometheus so you can begin visualizing your metrics.
Step 1: Log in to Grafana
By default, you can access the Grafana UI at the external IP or domain configured in the previous step. To access it, navigate to http://<external-ip>:3000 or your configured domain.
Log in using the default credentials:
Username: admin
Password: prom-operator
⚠️ Tip: If you’re using a different password (e.g., set via values.yaml or Helm), remember to use those credentials instead.
You’re now in!
If you navigate to Connection > Data sources from the left pane, you will notice that Prometheus is already configured as a data source:
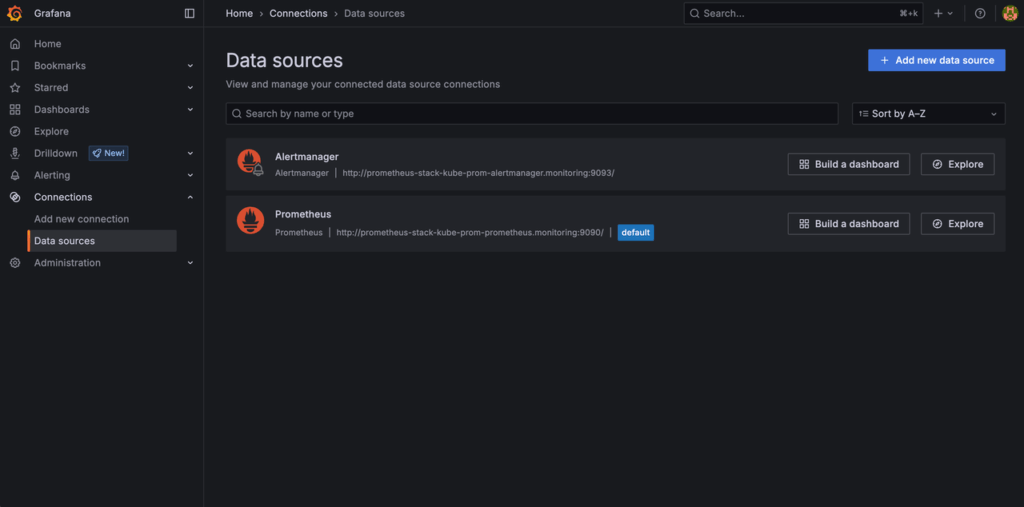
This means you can get started with building your dashboards right away!
Importing Pre-Built Dashboards for Node Exporter
Grafana’s community offers a wide range of pre-built dashboards for popular exporters, including Node Exporter, which we configured in Part 2 to monitor UpCloud Servers. Rather than building a dashboard from scratch, let’s start out by using one of the pre-made ones.
Step 1: Navigate to the Dashboard Import Page
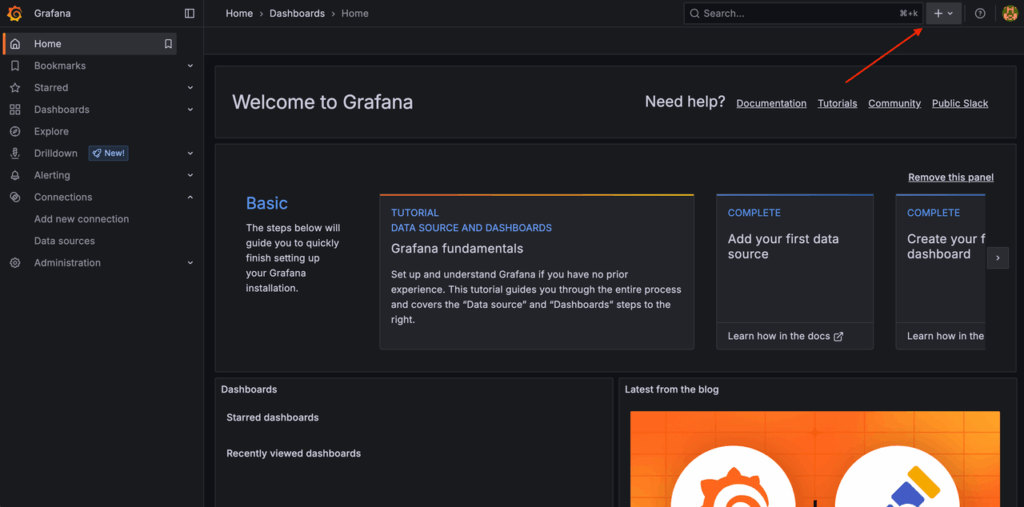
In the Grafana UI, click the + icon on the right side of the top bar:
Select Import Dashboard from the dropdown menu:
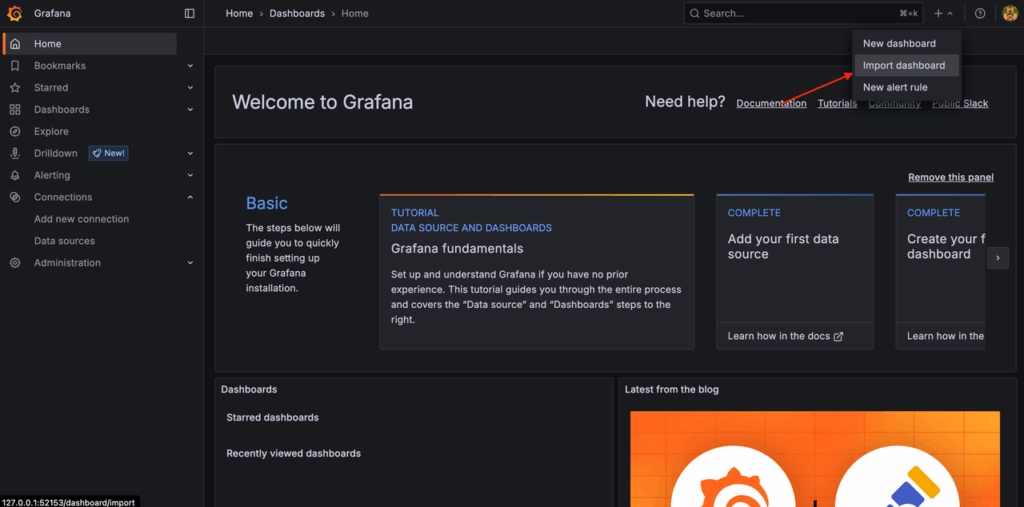
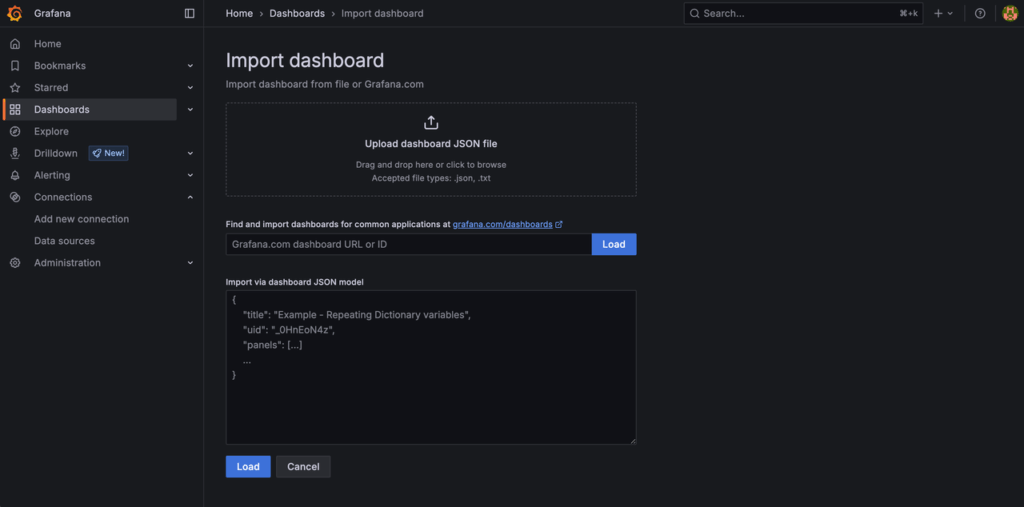
You’ll be prompted to either upload a JSON file or enter a dashboard ID from Grafana’s Dashboard Directory.
Step 2: Use Recommended Node Exporter Dashboards
You can import any of the following popular Node Exporter dashboards by entering the ID in the “Find and import dashboards for common applications at grafana.com/dashboards” field:
- 1860 Node Exporter Full: A detailed, all-in-one dashboard covering CPU, memory, disk, network, system load, and more.
- 11074 Node Exporter Server Metrics: A clean and minimal dashboard ideal for quick insights into system health.
After entering the dashboard ID, click Load. Grafana will then load the dashboard details and show them to you:
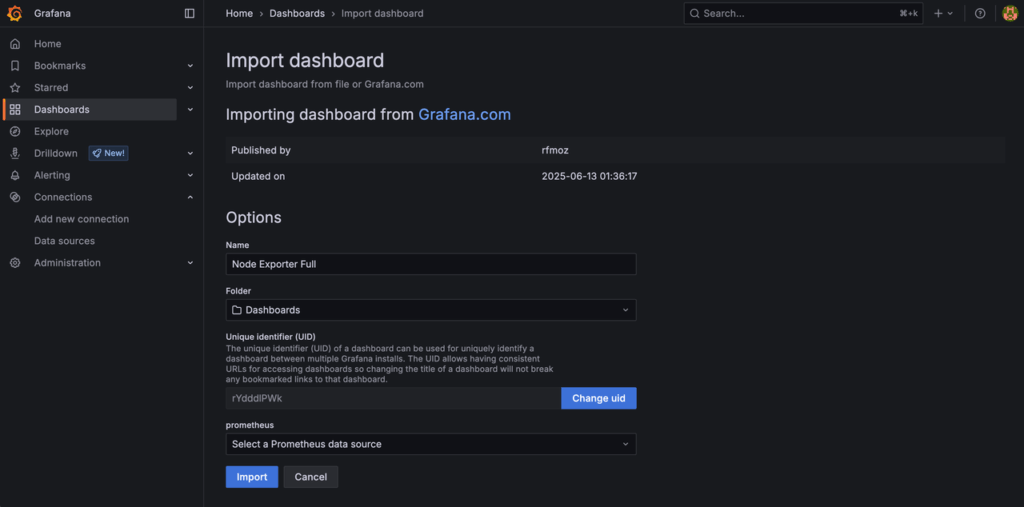
Step 3: Select the Prometheus Data Source
On this import screen, choose your Prometheus data source from the dropdown. Optionally, rename the dashboard. Finally, click Import to complete the process.
Once done, you will view the loaded dashboard:
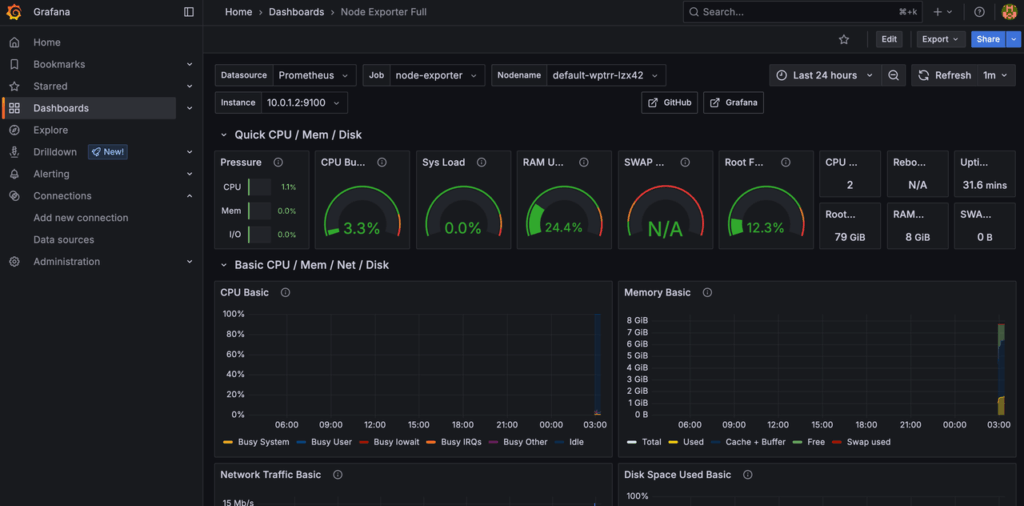
Step 4: Explore Key Panels
Once the dashboard loads, you’ll see metrics visualized using real-time panels. Common panels include:
- CPU Usage: User, system, idle, and steal percentages over time.
- Memory: Available vs. used memory, swap usage.
- Filesystem: Usage per mounted disk, inode availability.
- Network I/O: Bytes in/out, dropped packets, and errors per interface.
- System Load: Load averages (1m, 5m, 15m) with alert thresholds.
These dashboards give you a powerful starting point for infrastructure monitoring without having to write PromQL yourself.
Configuring Data Retention and Storage Settings
By default, Prometheus stores time-series data locally on disk with a retention period of 15 days. This means older data is automatically deleted after that window, which can impact the range of historical data available in Grafana dashboards.
If you want to analyze trends over a longer period, like 30, 60, or 90 days, you’ll need to adjust Prometheus’s storage settings.
Checking the Current Retention
If you installed Prometheus via kube-prometheus-stack, the retention period is likely managed via Helm values. You can confirm the current setting by reviewing the deployed config:
kubectl get pods -n monitoring
kubectl describe pod <prometheus-stack-pod-name> -n monitoring
In the pod description, look for the –-storage.tsdb.retention.time flag in the container’s args. Here’s what it will look like:
..
      /var/run/secrets/kubernetes.io/serviceaccount from kube-api-access-nzx55 (ro)
Containers:
  prometheus:
    Container ID:  containerd://a64f57ec5b029edbf4388f0e31b7491be36ddd35aaa3f3cf96fde5afca9487dd
    Image:         quay.io/prometheus/prometheus:v3.5.0
    Image ID:      quay.io/prometheus/prometheus@sha256:63805ebb8d2b3920190daf1cb14a60871b16fd38bed42b857a3182bc621f4996
    Port:          9090/TCP
    Host Port:     0/TCP
    Args:
      --config.file=/etc/prometheus/config_out/prometheus.env.yaml
      --web.enable-lifecycle
      --web.external-url=http://prometheus-stack-kube-prom-prometheus.monitoring:9090
      --web.route-prefix=/
      # Here's the value you're looking for 👇
      --storage.tsdb.retention.time=10d
      --storage.tsdb.path=/prometheus
      --storage.tsdb.wal-compression
...
Increasing Retention via Helm
To change the retention period to something longer, such as 30 days, you can either update the values.yaml file or pass the flag directly when installing/upgrading:
helm upgrade prometheus-stack prometheus-community/kube-prometheus-stack \
  --namespace monitoring \
  --set prometheus.prometheusSpec.retention="30d"
You can set this to any duration (e.g., 45d, 60d, or 1y) depending on your disk capacity and monitoring needs.
Considering Disk Storage Requirements
Setting a longer retention means more disk usage. A single monitored node might generate 150MB–1GB of data per day depending on scrape intervals. Therefore, you must ensure that your PersistentVolumeClaims (PVCs) for Prometheus have enough capacity.
To do that, you can configure storage in your values.yaml like so:
prometheus:
  prometheusSpec:
    storageSpec:
      volumeClaimTemplate:
        spec:
          resources:
            requests:
              storage: 50Gi
For truly long-term retention, Prometheus alone isn’t enough. In Part 5 of this series, you’ll learn about Thanos, which extends Prometheus with object storage support for durable, queryable metrics spanning months or years, without local disk constraints.
Creating Custom Dashboards
While pre-built dashboards provide excellent starting points, custom dashboards let you tailor your monitoring to specific workloads, services, and business requirements. Grafana’s dashboard builder supports powerful PromQL queries, diverse visualizations, and configurable alerting.
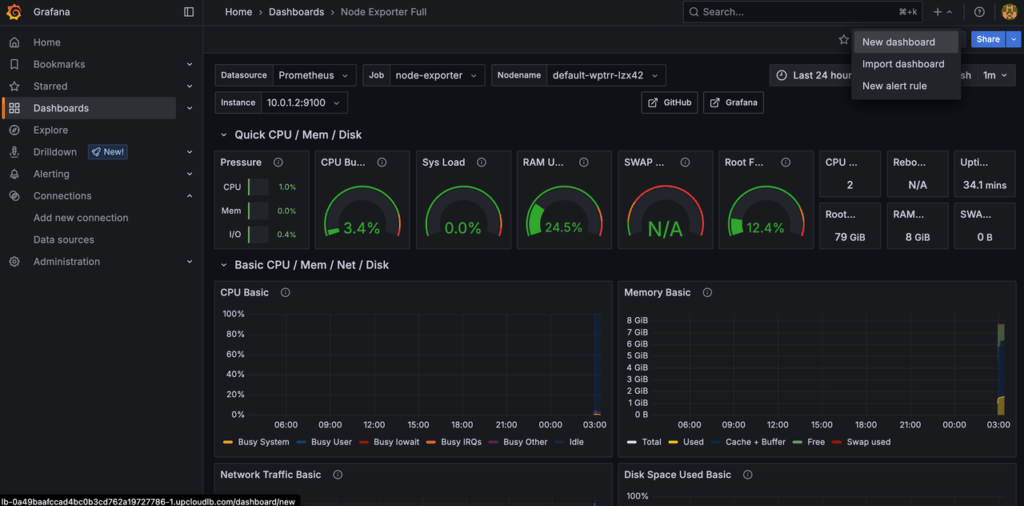
Step 1: Create a New Dashboard
To create a new dashboard, click the + icon on the right side of the topbar in Grafana and click New dashboard:
You will be taken to the new dashboard screen:
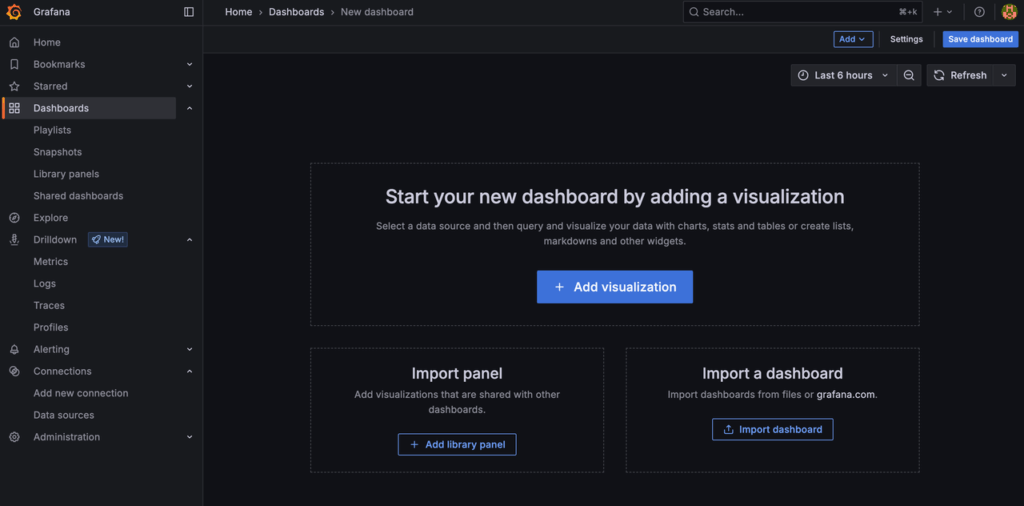
Click the Add visualization to create your first panel. This opens the panel editor where you’ll configure queries and visualizations.
Step 2: Configure Your Data Source and Query
In the Select data source modal, select your Prometheus data source from the dropdown:
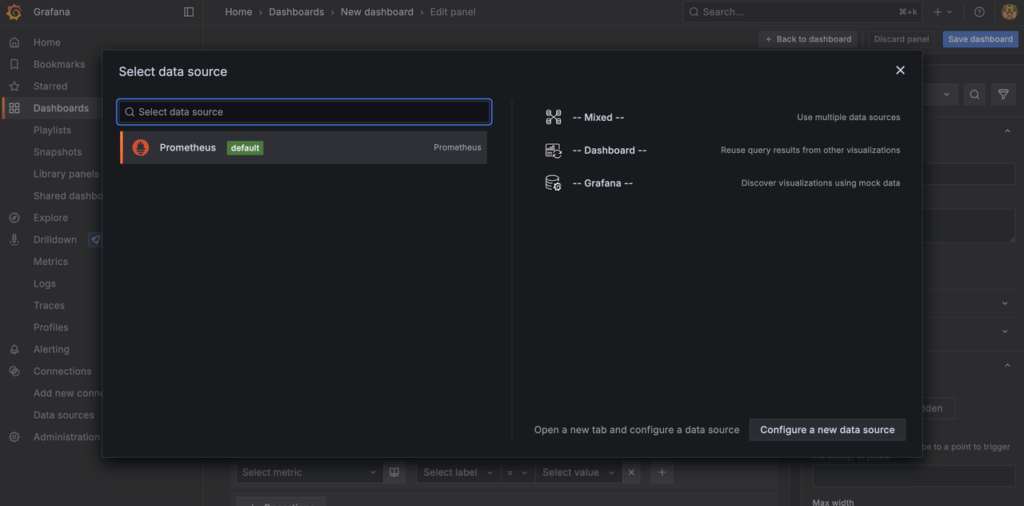
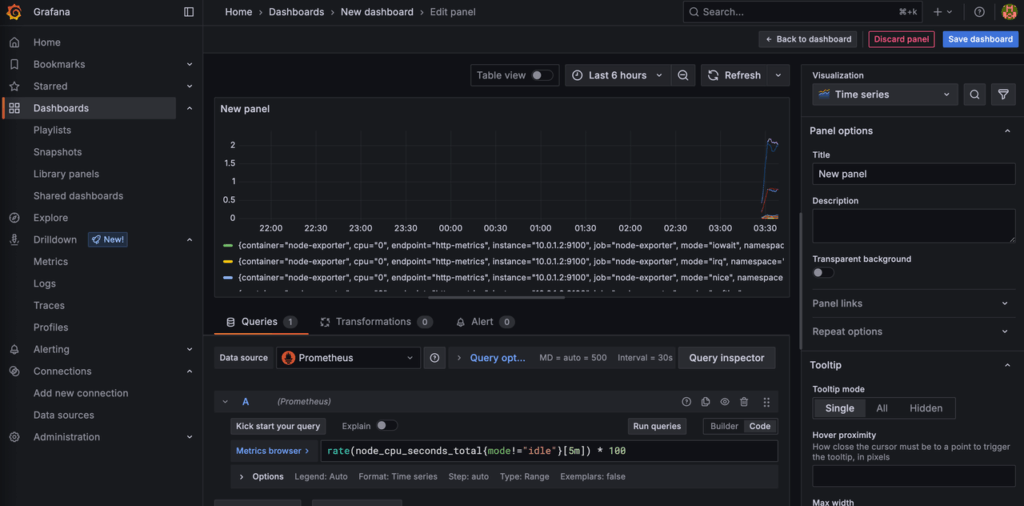
Then, enter a PromQL expression in the query field. For example:
rate(node_cpu_seconds_total{mode!="idle"}[5m]) * 100This shows CPU utilization as a percentage, excluding idle time, averaged over 5 minutes.
Click Run query to preview the results and verify your data.
Here’s what it should look like when done:
Now, you can use the Query options to set refresh intervals or relative time ranges:
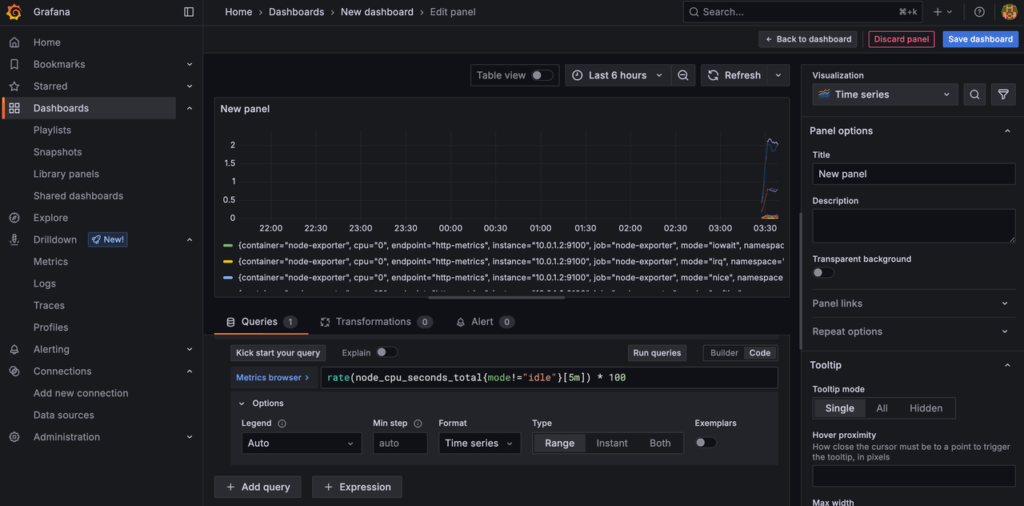
Pro tip: Consider using Grafana’s query builder for complex queries, or explore metrics with the Metrics explorer.
Step 3: Customize Your Visualization
In the Panel options section on the right, you can further customize how the panel will appear in the dashboard. For example, you can set the visualization type from one of many options, such as:
- Time series: Line charts for metrics over time
- Stat: Single value displays with sparklines
- Gauge: Semi-circular progress indicators
- Bar chart: Compare values across categories
- Heatmap: Show data density and patterns
In the Panel Options, you can set the following details:
- Panel title: Give your panel a descriptive name
- Description: Add context for other team members
Furthermore, based on your visualization type, you can customize other details such as legends, axes, graph styles, etc.
Step 4: Save and Organize Your Dashboard
Once you’re happy with how your panel looks, click Save dashboard to add the panel to your dashboard and save it. You might be asked to provide:
- Dashboard name
- Folder location
- Description and tags for organization
You can now continue building your dashboard as you like! Custom dashboards enable you to move beyond basic infrastructure monitoring to track application-specific KPIs, SLA metrics, business logic, and user experience, all unified through Prometheus data.
Conclusion
With Grafana integrated into your monitoring stack, you’re no longer just collecting raw Prometheus metrics; you’re now also transforming them into rich, actionable visualizations. Whether you’re tracking CPU usage across UpCloud cloud servers, monitoring memory spikes in Kubernetes nodes, or customizing dashboards for your own applications, Grafana provides the observability layer that brings everything together.
By importing pre-built dashboards like Node Exporter Full or designing your own panels with PromQL, you gain real-time insight into system performance and resource trends. And with retention settings tuned appropriately, you can scale your monitoring window as you like, giving you a much clearer picture of how your infrastructure evolves over time.
In the next part of this series, we’ll take things further by instrumenting custom applications to expose Prometheus-compatible metrics. You’ll learn how to track app-level performance indicators, set up metrics endpoints, and visualize them side-by-side with your infrastructure metrics in Grafana.
Discussion