After setting up the foundation with infrastructure-level monitoring in earlier parts of this series (tracking Kubernetes workloads, VM metrics, and visualizing them in Grafana), you have a solid understanding of system health and resource usage monitoring. But infrastructure metrics only tell part of the story. To truly understand your applications’ behavior, you need to observe them from the inside.
This is where application-level monitoring comes in. You can track key business and operational metrics like request latency, error rates, memory consumption, and custom KPIs unique to your domain by instrumenting your applications with Prometheus client libraries.
In this article, you’ll learn how to use Prometheus client libraries in Node.js and Python applications, expose /metrics endpoints, and configure Prometheus to scrape them. You’ll also explore how to validate the setup, write useful PromQL queries, and create dashboards in Grafana to visualize your app’s real-time performance.
To see the previous parts of the series you can access here:
- Monitoring in UpCloud with Prometheus: Part 1
- Monitoring in UpCloud with Prometheus: Part 2
- Monitoring in UpCloud with Prometheus: Part 3
Prometheus Client Libraries
Prometheus offers a list of official and community-backed client libraries that allow you to instrument your applications by exposing internal metrics in a format that Prometheus understands. These libraries are available for most major languages, including:
- Python: client_python
- Go: client_golang
- Java: client_java
- Rust: client_rust
- Ruby: client_ruby
A longer list of libraries is available via third-party or community support, which includes
Node.js, C++, and more.
These libraries expose an HTTP endpoint (usually /metrics) that Prometheus scrapes at regular intervals.
Built-in Metrics Provided by Most Libraries
Prometheus client libraries offer several default metric types, and many include common process-level collectors by default. These include:
- process_cpu_seconds_total: total user and system CPU time
- process_resident_memory_bytes: memory used by the process
- http_requests_total: number of HTTP requests (with labels like status code and method)
- http_request_duration_seconds: request latency histogram
- Garbage collection stats (for languages with managed memory like Java, Node.js, Python)
On top of these, you can also define custom metrics specific to your business or application. Some common custom metrics include:
- Orders processed
- Users signed up
- Background jobs queued or completed, etc.
Next up, you will learn how to instrument two basic apps with the Prometheus client libraries, deploy them onto your UpCloud cluster, and view their metrics in your Grafana dashboards!
Prerequisites
Before you can go ahead with the tutorial, you will need to ensure that you have the following:
- An existing Prometheus + Grafana setup on an UpCloud Managed Kubernetes cluster (from earlier parts of this series).
- Basic knowledge of Node.js and Python.
- kubectl and helm installed and configured correctly
Instrumenting a Node.js Application
To expose application-level metrics from a Node.js service, you’ll use the third-party Prometheus client library: prom-client. It supports a variety of metric types: counters, gauges, histograms, and summaries. And, it provides built-in process and garbage collection metrics.
Step 1: Install prom-client
In your Node.js project, install the package:
npm install prom-clientStep 2: Create a /metrics Endpoint
In your Express (or other HTTP framework) application, set up a /metrics route that exposes Prometheus-compatible metrics:
const express = require('express');
const client = require('prom-client');

const app = express();
const port = 3000;

// Enable default metrics collection
client.collectDefaultMetrics();

// Example custom metric
const httpRequestCounter = new client.Counter({
  name: 'http_requests_total',
  help: 'Total number of HTTP requests',
  labelNames: ['method', 'route', 'status']
});

// Middleware to increment counter on each request
app.use((req, res, next) => {
  res.on('finish', () => {
    httpRequestCounter.labels(req.method, req.path, res.statusCode).inc();
  });
  next();
});

// Your application routes here
app.get('/', (req, res) => {
  res.send('Hello, world!');
});

// Metrics endpoint
app.get('/metrics', async (req, res) => {
  res.set('Content-Type', client.register.contentType);
  res.end(await client.register.metrics());
});

app.listen(port, () => {
  console.log(`App listening at http://localhost:${port}`);
});
Step 3: Run the App Locally
Start your application:
node app.js
Navigate to http://localhost:3000/metrics, and you should see Prometheus-formatted metrics including memory usage, CPU time, and your custom http_requests_total counter.
Next, we’ll walk through the same process for a Python application using the prometheus_client library.
Instrumenting a Python Application
In Python, the official Prometheus client library is prometheus_client. It makes it easy to expose standard and custom metrics via an HTTP endpoint that Prometheus can scrape.
Step 1: Install prometheus_client
Install the library using pip:
pip install prometheus_client
Step 2: Create a Basic App With Metrics
Here’s a simple Flask app that exposes a /metrics endpoint and tracks request counts and latencies:
Step 2: Create a Basic App With Metrics
Here’s a simple Flask app that exposes a /metrics endpoint and tracks request counts and latencies:
from flask import Flask, Response, request
from prometheus_client import Counter, Histogram, generate_latest, CONTENT_TYPE_LATEST
import time

app = Flask(__name__)

# Define metrics
REQUEST_COUNT = Counter('http_requests_total', 'Total HTTP requests', ['method', 'endpoint', 'status_code'])
REQUEST_LATENCY = Histogram('http_request_duration_seconds', 'Request latency', ['endpoint'])
@app.before_request
def start_timer():
    request.start_time = time.time()

@app.after_request
def record_metrics(response):
    latency = time.time() - request.start_time
    REQUEST_COUNT.labels(request.method, request.path, response.status_code).inc()
    REQUEST_LATENCY.labels(request.path).observe(latency)
    return response

@app.route('/')
def index():
    return 'Hello, world!'

@app.route('/metrics')
def metrics():
    return Response(generate_latest(), mimetype=CONTENT_TYPE_LATEST)

if __name__ == '__main__':
    app.run(host='0.0.0.0', port=8000)
Step 3: Run the App Locally
Start the Flask app:
python app.py
Now visit http://localhost:8000/metrics to see the exposed Prometheus metrics. These will include:
- Default process metrics (memory usage, CPU time, etc.)
- Your custom metrics:
- http_requests_total
- http_request_duration_seconds
In the next section, we’ll configure Prometheus to scrape these application endpoints so that you can analyze and visualize the metrics.
Deploying the Apps
To collect metrics from your instrumented applications in a Kubernetes environment, you first need to containerize the apps and deploy them to your cluster.
Step 1: Dockerize the Applications
Create a Dockerfile in the root of your Node.js project:
# Use official Node.js image
FROM node:24-alpine

WORKDIR /app

COPY package*.json ./
RUN npm install

COPY . .

EXPOSE 3000
CMD ["node", "app.js"]
Similarly, create a Dockerfile for the Python Flask app:
FROM python:3.13-slim

WORKDIR /app

COPY requirements.txt ./
RUN pip install -r requirements.txt

COPY . .

EXPOSE 8000
CMD ["python", "app.py"]
Make sure you create a requirements.txt file that includes flask and prometheus_client.
Step 2: Deploy Applications to Kubernetes
With the Dockerfiles in place, build and push the images to a container registry (like Docker Hub or GitHub Container Registry). To do that, run the following commands in the Node.js project directory, replacing <your-dockerhub-username> with your actual Docker Hub username:
docker build -t <your-dockerhub-username>/nodejs-app:latest ./nodejs-app
docker push <your-dockerhub-username>/nodejs-app:latest
Similarly, run the following commands in the Python project directory, replacing <your-dockerhub-username> with your actual Docker Hub username:
docker build -t <your-dockerhub-username>/python-app:latest ./python-app
docker push <your-dockerhub-username>/python-app:latest
If you are using an ARM architecture machine (such as a Mac with an Apple Silicon chip), you will need to use Docker Buildx to ensure that the Docker image is built for linux/amd64, not ARM:
docker buildx build --platform linux/amd64 -t <your-dockerhub-username>/nodejs-app:latest . --pushOnce the images are pushed to Dockerhub, you need to define Kubernetes manifests for both applications.
Here’s what the manifest for the Node.js app will look like:
# nodejs-app.yaml
apiVersion: apps/v1
kind: Deployment
metadata:
  name: nodejs-app
spec:
  replicas: 1
  selector:
    matchLabels:
      app: nodejs-app
  template:
    metadata:
      labels:
        app: nodejs-app
    spec:
      containers:
        - name: nodejs-app
          image: <your-dockerhub-username>/nodejs-app:latest
          ports:
            - containerPort: 3000
          readinessProbe:
            httpGet:
              path: /metrics
              port: 3000

---
apiVersion: v1
kind: Service
metadata:
  name: nodejs-app
  labels:
    app: nodejs-app
spec:
  selector:
    app: nodejs-app
  ports:
    - name: http
      port: 3000
      targetPort: 3000
This manifest deploys a single-replica Node.js application to Kubernetes and exposes its /metrics endpoint on port 3000 using a readiness probe. The associated Service makes the app accessible internally under the name nodejs-app, with a named port http, which is needed for the Prometheus ServiceMonitor to correctly identify and scrape it.
Here’s what the manifest for the Python app will look like:
# python-app.yaml
apiVersion: apps/v1
kind: Deployment
metadata:
  name: python-app
spec:
  replicas: 1
  selector:
    matchLabels:
      app: python-app
  template:
    metadata:
      labels:
        app: python-app
    spec:
      containers:
        - name: python-app
          image: <your-dockerhub-username>/python-app:latest
          ports:
            - containerPort: 8000
          readinessProbe:
            httpGet:
              path: /metrics
              port: 8000

---
apiVersion: v1
kind: Service
metadata:
  name: python-app
  labels:
    app: python-app
spec:
  selector:
    app: python-app
  ports:
    - name: http
      port: 8000
      targetPort: 8000
This manifest deploys a single-replica Python application exposing Prometheus-compatible metrics on port 8000. Like the Node.js setup, it defines a readiness probe targeting /metrics and exposes the app through a Kubernetes Service.
Make sure to replace <your-dockerhub-username> with the correct value before saving both of the files.
Once you have created both of these files, apply them to your UpCloud cluster by running the following commands:
kubectl apply -f nodejs-app.yaml
kubectl apply -f python-app.yaml
You can now run kubectl get svc to see if both of these apps have been deployed correctly on your cluster:
$ p3 kubectl get svc
NAME         TYPE        CLUSTER-IP     EXTERNAL-IP   PORT(S)    AGE
kubernetes   ClusterIP   10.96.0.1      <none>        443/TCP    22m
nodejs-app   ClusterIP   10.96.203.53   <none>        3000/TCP   5m12s
python-app   ClusterIP   10.96.73.42    <none>        8000/TCP   116s
This means that the apps are deployed correctly on your cluster! You could also try running kubectl port-forward on the services to access and verify that the /metrics endpoint is up and running on both of the apps.
Configuring Prometheus to Scrape Application Endpoints
Once your instrumented Node.js and Python applications are deployed in your Kubernetes cluster, all you need to do is instruct Prometheus to discover and scrape their /metrics endpoints. In a standalone Prometheus setup, you might use a static list of targets. But in Kubernetes, especially when using the kube-prometheus-stack, the preferred and scalable way to do this is via ServiceMonitor resources.
A ServiceMonitor is a custom resource provided by the Prometheus Operator. It defines:
- What services to scrape,
- On which ports and paths, and
- At what intervals.
The Prometheus instance deployed by kube-prometheus-stack does not scrape arbitrary Kubernetes services by default. Instead, it watches for ServiceMonitor resources that match its configured label selectors. This ensures Prometheus only scrapes explicitly defined and authorized targets, improving both security and maintainability.
You can use the ServiceMonitor configurations given below for both of your apps:
For the Node.js app, save the following in a file called nodejs-servicemonitor.yaml:
apiVersion: monitoring.coreos.com/v1
kind: ServiceMonitor
metadata:
  name: nodejs-app
  namespace: monitoring
  labels:
    release: prometheus-stack
spec:
  selector:
    matchLabels:
      app: nodejs-app
  namespaceSelector:
    matchNames:
      - default
  endpoints:
    - port: http
      path: /metrics
      interval: 15s
For the Python app, save the following in a file called python-servicemonitor.yaml:
apiVersion: monitoring.coreos.com/v1
kind: ServiceMonitor
metadata:
  name: python-app
  namespace: monitoring
  labels:
    release: prometheus-stack
spec:
  selector:
    matchLabels:
      app: python-app
  namespaceSelector:
    matchNames:
      - default
  endpoints:
    - port: http
      path: /metrics
      interval: 15s
Here is a quick summary of the important nodes in each ServiceMonitor resource, and what they control:
metadata.namespace: monitoring: This must match the namespace where your Prometheus instance is deployed. The Prometheus Operator only watches for ServiceMonitor resources in its own namespace (unless explicitly configured otherwise).
metadata.labels.release: prometheus-stack: This label must match the label selector used by your Prometheus resource. The kube-prometheus-stack chart defaults to release: prometheus-stack, but you can confirm this by inspecting your Prometheus custom resource:
kubectl get prometheus -n monitoring -o yaml | grep selector
spec.selector.matchLabels.app: nodejs-app / python-app: This must match the labels on the Kubernetes Service, not the pod or deployment. For example:
kind: Service
metadata:
labels:
app: nodejs-app
spec.namespaceSelector.matchNames: [default]: Specifies the namespace where the target Service lives. In this setup, both apps run in the default namespace, while Prometheus and the ServiceMonitor live in monitoring.
spec.endpoints.port: http: This must match the named port in your Service definition. If your service defines:
ports:
– name: http
port: 3000
then port: http is correct. If the port name is different (or missing), Prometheus won’t know which port to scrape.
- spec.endpoints.path: /metrics: Defines the HTTP path where your application exposes metrics. This should match your app’s implementation (e.g., Flask or Express route).
- spec.endpoints.interval: 15s: Controls how frequently Prometheus scrapes the endpoint. Use a smaller interval (e.g., 15s) for low-latency, high-resolution metrics, and increase it if scrape load becomes an issue.
Once both ServiceMonitor resources are deployed, Prometheus will automatically discover and begin scraping your app metrics.
Verifying and Querying Application Metrics
Now, it’s time to validate that Prometheus is successfully scraping the apps’ metrics. To do that, port-forward the Prometheus service so you can access it locally:
kubectl port-forward svc/prometheus-stack-kube-prom-prometheus 9090 -n monitoring
Then open your browser to http://localhost:9090/query. On the query page, run the following query:
up{container=~"nodejs-app|python-app"}
This should bring up the health status of the two service containers:
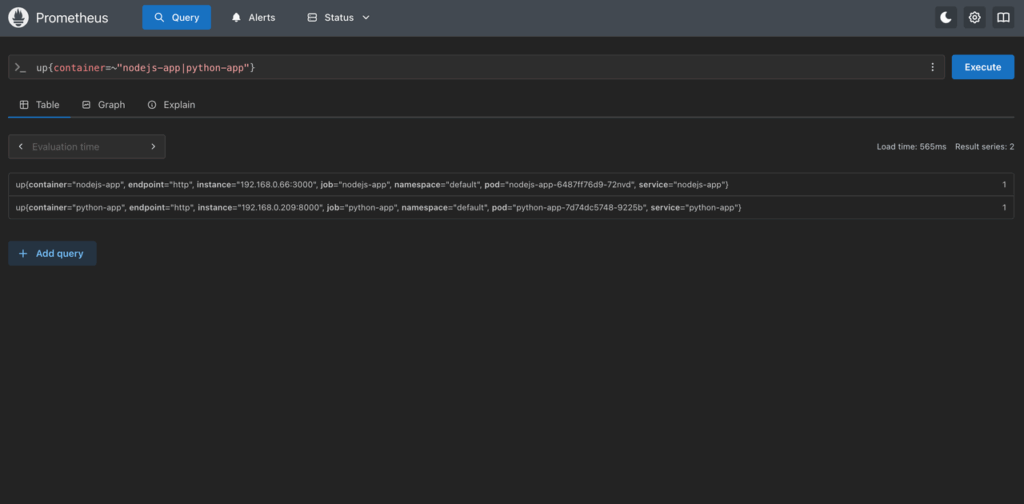
If you don’t see the targets, confirm that the ServiceMonitor label selectors match your services. Also, ensure the target port name matches what’s defined in the ServiceMonitor.
If the query runs fine, switch to the Graph tab and try a few more PromQL expressions to verify that metrics are coming in:
Basic Up Check
up{job="nodejs-app"}
or
up{job="python-app"}
You should see a value of 1 plotted on the graph if the application is being scraped successfully:
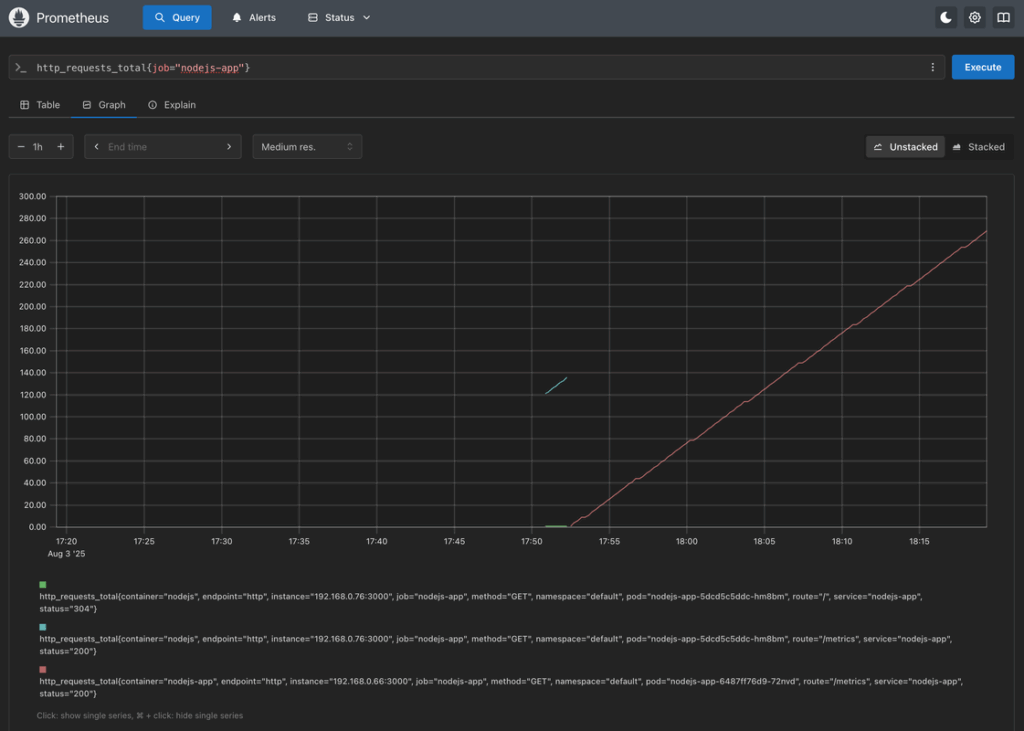
HTTP Request Count
http_requests_total{job="nodejs-app"}
This will return the number of HTTP requests handled by your Node.js app:
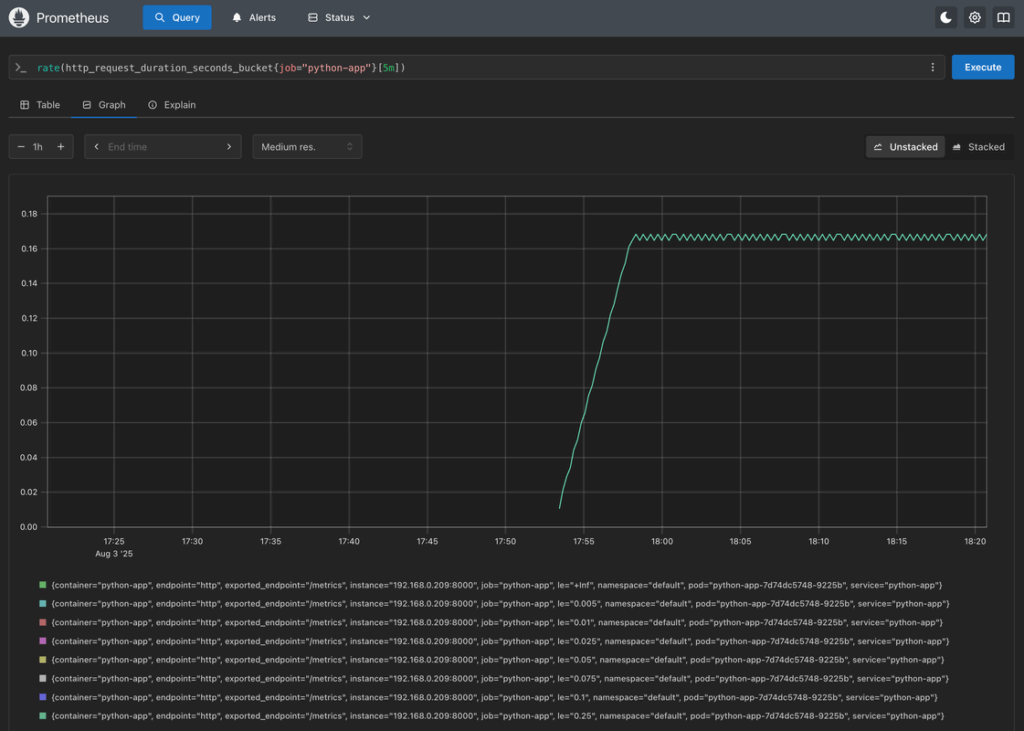
Request Latency Histogram (Python)
rate(http_request_duration_seconds_bucket{job="python-app"}[5m])
This will show the rate of requests falling into different latency buckets:
Memory Usage (Default Metric)
process_resident_memory_bytes{job="python-app"}
This will report the memory used by the Python process:
Since you’ve already set up Grafana as part of the previous part of this tutorial, you can access it by running the following port-forward command:
kubectl port-forward svc/prometheus-stack-grafana 3000:80 -n monitoring
Next, visit http://localhost:3000 and log in. You’re now ready to create app-specific dashboards!
Create a Basic Dashboard
To get started:
- Go to Dashboards > New > New Dashboard
- Click Add visualization and select Prometheus as the data source, if asked.
In the query box, enter:
rate(http_requests_total{job=”nodejs-app”}[1m])
- Set visualization type to Time series
- Give it a title like Node.js Request Rate
- Repeat for
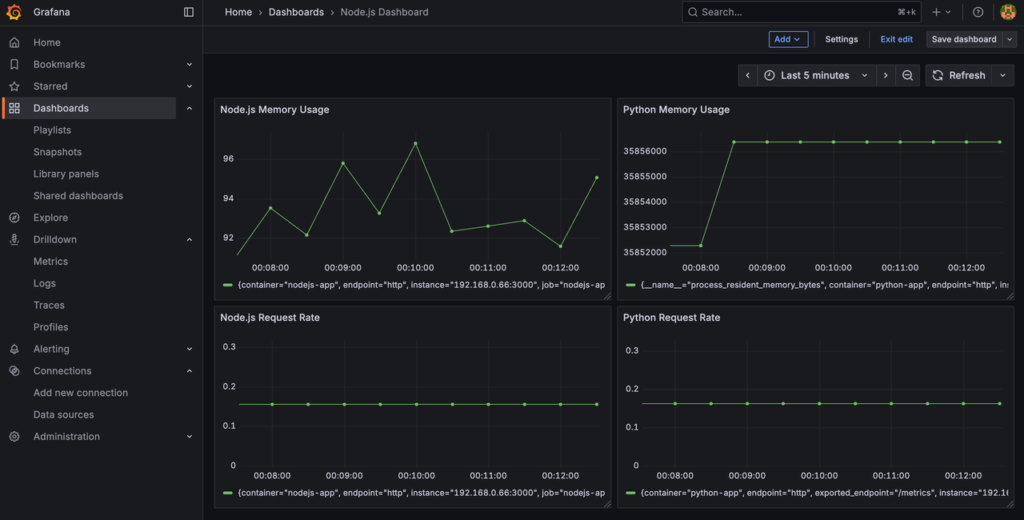
a. Node.js Memory Usage: (nodejs_heap_size_used_bytes / nodejs_heap_size_total_bytes) * 100
b. Python Request Rate: rate(http_requests_total{container=”python-app”}[$__rate_interval])
c. Python Memory Usage: process_resident_memory_bytes{container=”python-app”}
latency (histogram_quantile(0.95, sum(rate(http_request_duration_seconds_bucket[1m])) by (le))) or memory usage queries
Here’s what the dashboard should look like when done:
You can also import community dashboards from Grafana’s dashboard directory by searching for Flask Monitoring or Node.js Dashboard.
Once dashboards are set up, you’ll have real-time visibility into application-level metrics alongside your infrastructure observability, all within the same stack!
Conclusion
With application-level instrumentation in place, your observability stack is now complete! While Prometheus and Grafana already gave you deep insights into infrastructure health, adding custom metrics from your application logic, like request counts, response times, and memory usage, unlocks a new layer of visibility. This enables your team to monitor performance trends, troubleshoot issues faster, and track real business KPIs that infrastructure metrics alone can’t provide.
As your observability needs grow, defining domain-specific metrics becomes increasingly valuable. Think beyond technical health: track things like order volume, user registrations, job queue depth, or payment failures. These metrics bring observability closer to what actually matters to your business.
In the final part of this series, we’ll show you how to scale your monitoring setup with Thanos, enabling long-term metrics storage, high availability, and global querying, all running on UpCloud!
Discussion