So far in this series, you’ve built a complete observability foundation on UpCloud. You’ve set up Prometheus and Grafana to monitor infrastructure-level metrics from Kubernetes and VMs, and you’ve added application-level instrumentation using Prometheus client libraries for real-time insights into your workloads. With dashboards and alerts in place, your system is observant. The only aspect you haven’t considered yet is the storage of all this data.
Prometheus, by default, only retains data for a limited time and stores it locally, making it unsuitable for historical analysis or disaster recovery purposes. If a pod is deleted or a cluster is wiped, all metrics vanish. For production environments, this is a major risk.
This is where Thanos comes in.
Thanos is a CNCF project that extends Prometheus by solving three major limitations: short retention periods, siloed data from individual Prometheus instances, and inefficient historical queries. It does this by:
- Uploading metrics to cloud object storage for long-term retention
- Allowing federated querying across multiple Prometheus instances
- Supporting downsampling for faster queries over large time ranges
In this final part of the series, you’ll integrate Thanos into your existing UpCloud observability stack. You’ll install the Thanos Sidecar alongside Prometheus to enable metrics shipping to UpCloud Object Storage. Then, you’ll deploy key Thanos components—Query and Store Gateway—and wire the setup into Grafana for easy historical metrics analysis.
By the end of this guide, your monitoring system will be ready for production at scale, capable of answering queries that span weeks or months, and resilient to Prometheus restarts or cluster failures.
To see the previous parts of the series you can access them here:
- Monitoring in UpCloud with Prometheus: Part 1
- Monitoring in UpCloud with Prometheus: Part 2
- Monitoring in UpCloud with Prometheus: Part 3
- Monitoring in UpCloud with Prometheus: Part 4
Prerequisites
Before you can go ahead with the tutorial, you will need to ensure that you have the following:
- An existing Prometheus + Grafana setup on an UpCloud Managed Kubernetes cluster (from earlier parts of this series).
- Basic knowledge of Node.js and Python.
- kubectl and helm installed and configured correctly
Installing Thanos Sidecar with Prometheus
To start extending your observability stack with long-term storage and global querying, you’ll deploy the Thanos Sidecar alongside your Prometheus instance. The Sidecar enables:
- Uploading TSDB blocks from Prometheus to UpCloud Object Storage for long-term durability.
- Exposing a Store API endpoint, making Prometheus data available to other Thanos components like Query and Store Gateway.
The kube-prometheus-stack chart simplifies this integration with built-in support for Thanos. Here’s how to enable it:
Step 1: Create an UpCloud Object Storage Bucket
Before you add the sidecar, you will need to set up an S3-like object storage bucket where Thanos will store your historic metrics data. To do that, head to your UpCloud dashboard and click Object Storage from the left navigation pane. This is where you need to:
- Create a new object storage instance.
- Create an object bucket inside your storage instance.
- Create a new User object in the storage instance.
- Attach the ECSS3FullAccess policy to the user.
- Generate and download the access key and the secret key for the user.
You will find detailed instructions on how to do that in this guide.
Make sure to retrieve the bucket name, object storage endpoint, access key, and secret key from your UpCloud storage instance before moving ahead.
Step 2: Create a Config Secret to Store the Bucket Details
Thanos needs a config file (objstore.yml) with the credentials of the object storage bucket to connect to it.
Create a file named objstore.yml and save the following in it, replacing the placeholders with the values you retrieved from UpCloud in the last step:
type: S3
config:
  bucket: "<your-bucket-name>"
  endpoint: "your-region-specific-endpoint"
  access_key: "<your-access-key>"
  secret_key: "<your-secret-key>"
  insecure: false
Using this file, create the secret in Kubernetes:
kubectl create secret generic thanos-objstore-config \
–from-file=objstore.yml \
-n monitoring
You will reference this secret in your Thanos configuration to enable it to connect to your bucket.
Step 3: Enable Thanos Sidecar via Helm Values
Update your values.yaml for the kube-prometheus-stack chart to include:
prometheus:
  prometheusSpec:
    disableCompaction: true
    thanos:
      image: quay.io/thanos/thanos:v0.39.2
      objectStorageConfig:
        existingSecret:
          name: thanos-objstore-config
          key: objstore.yml

alertmanager:
  enabled: true

grafana:
  enabled: true
Here’s what each setting does:
- disableCompaction: true: disables Prometheus’s built-in compaction to prevent conflicts with Thanos, which handles compaction centrally via its own components.
- thanos.image: explicitly sets the Thanos version to ensure consistency across environments.
- objectStorageConfig.existingSecret: tells Prometheus where to find the object storage credentials, using the secret created in Step 2.
Step 4: Upgrade the Stack
Apply your changes by upgrading the Helm release:
helm upgrade prometheus-stack prometheus-community/kube-prometheus-stack \
-n monitoring \
-f values.yaml
Once the deployment finishes, verify that the Prometheus pod now includes the Thanos Sidecar (as thanos-sidecar) by running the following command:
$ kubectl get pod prometheus-prometheus-stack-kube-prom-prometheus-0 -n monitoring -o jsonpath=”{.spec.containers[*].name}”
prometheus config-reloader thanos-sidecar
To confirm the Sidecar is running properly, check its logs:
kubectl logs pods/prometheus-prometheus-stack-kube-prom-prometheus-0 -c thanos-sidecar -n monitoring
If you see something like this:
level=warn ts=2025-08-15T09:43:26.285420195Z caller=sidecar.go:345 err=”check exists: stat s3 object: Access Denied.” uploaded=0
It might indicate that either the credentials of your UpCloud storage instance user are incorrect, or you have not attached the right policy to the user.
If you see something like this:
level=info ts=2025-08-15T09:47:56.28366975Z caller=shipper.go:334 msg=”upload new block” id=01K2N83AK6V82AAY94FC58NBZD
It means that the sidecar has been set up correctly and is storing data in your UpCloud bucket!
You can also check out the stored blocks in the bucket:
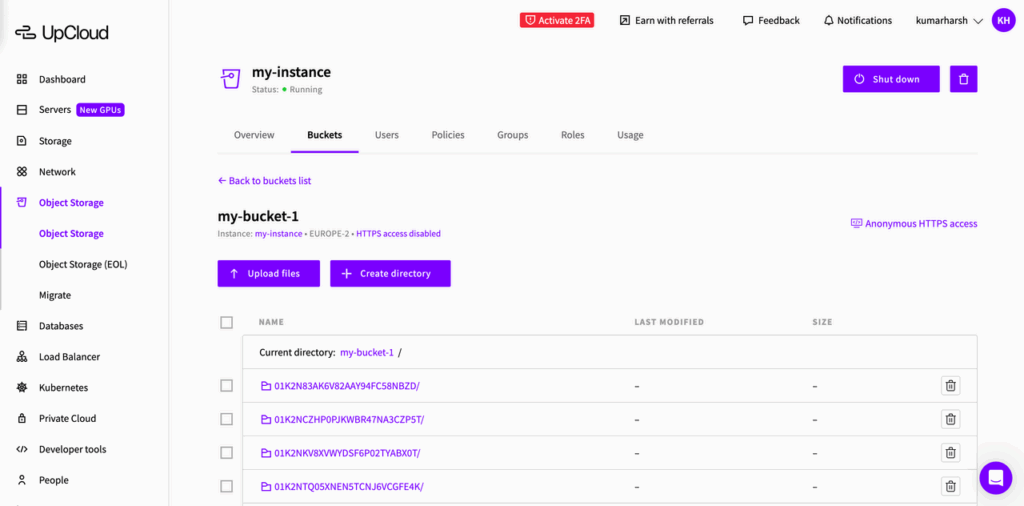
However, the setup isn’t complete at this point. Your stack can only upload TSDB data blocks for long-term storage. To be able to retrieve and query that data, you need to set up some more Thanos components: Store Gateway and Query.
Setting Up Other Thanos Components: Query and Store Gateway
Now, you’ll set up Thanos Store Gateway, Query, and Compactor. Here’s a quick summary of what each one of those does:
- Thanos Query acts as a unified PromQL query layer that can aggregate metrics from multiple sources.
- Thanos Store Gateway serves historical TSDB blocks stored in UpCloud Object Storage.
- Thanos Compactor deduplicates, downsamples, and cleans up stored blocks, making queries over weeks or months efficient and reliable.
All three can be installed using the Bitnami Thanos Helm chart, which works well alongside your existing kube-prometheus-stack installation.
To set these up, follow these steps:
Step 1: Add the Bitnami Chart Repository
Add the Bitnami repo (if you haven’t already):
helm repo add bitnami https://charts.bitnami.com/bitnami
helm repo update
Step 2: Set up the thanos-values.yaml file
Save the following configuration for the chart in a file named thanos-values.yaml:
existingObjstoreSecret: thanos-objstore-config

query:
  enabled: true
  replicaCount: 1
  stores:
    - dnssrv+_grpc._tcp.prometheus-operated.monitoring.svc.cluster.local  # Prometheus Sidecar
    - thanos-storegateway.monitoring.svc.cluster.local:10901              # Store Gateway

storegateway:
  enabled: true
  replicaCount: 1

compactor:
  enabled: true
  replicaCount: 1
  retentionResolutionRaw: 30d
  retentionResolution5m: 180d
  retentionResolution1h: 2y
  consistencyDelay: 30m
  persistence:
    enabled: true
    storageClass: standard
    size: 10Gi
Let’s break down what each section does:
- existingObjstoreSecret: Tells all Thanos components to use the existing Kubernetes secret named thanos-objstore-config, which you created earlier
- query: Turns on the Thanos Query component, sets the replica count to one, and defines a list of stores to pull data from. The first entry on this list will set the query component to dynamically discover all Prometheus Sidecars in the monitoring namespace via DNS SRV records. The second entry is the internal service address of the Store Gateway, which serves historical blocks from object storage
- storegateway: Deploys the Store Gateway and sets the replica count to one.
- compactor: Enables the Thanos Compactor, and sets the replica count to 1 (which must not be changed, as the compactor is not meant to be run in parallel). Here’s what the other keys do:
- retentionResolutionRaw: Keep raw (high-resolution) metrics for 30 days.
- retentionResolution5m: Keep 5-minute downsampled data for 180 days.
- retentionResolution1h: Keep 1-hour downsampled data for 2 years.
- consistencyDelay: 30m: Adds a buffer time to ensure blocks are fully uploaded before compaction kicks in, avoiding corruption or race conditions.
- persistence: Enables durable disk storage for temporary files during compaction.
- enabled: true: Activates persistent volume usage.
- storageClass: standard: Specifies the storage class to use—change this to match your UpCloud setup if needed.
- size: 10Gi: Allocates 10Gi of disk space for compactor temp files.
Without persistence, the compactor state would be lost on pod restart, which could lead to redundant or failed compaction cycles.
Step 3: Install the Thanos Release
Install all components in one go with this command:
helm upgrade –install thanos bitnami/thanos \
–namespace monitoring \
-f thanos-values.yaml
This deploys all three components into your monitoring namespace and wires them up to your Prometheus Sidecar and object storage backend.
Step 4: Verify the Deployment
Check that all pods are running:
$ kubectl get pods -n monitoring -l app.kubernetes.io/instance=thanos
NAME                                     READY   STATUS    RESTARTS   AGE
thanos-compactor-844d8c8d76-9z8n5        1/1     Running   0          5h21m
thanos-query-c89bf5d95-ktmv6             1/1     Running   0          5h21m
thanos-query-frontend-59564bf878-qctvz   1/1     Running   0          5h21m
thanos-storegateway-0                    1/1     Running   0          5h13m
Once all components are healthy, your Thanos stack is fully functional: it can store, optimize, and serve months or even years of Prometheus metrics at scale!
Exploring the New Setup
Now that Thanos is set up, let’s explore a few things.
Accessing the Thanos Query UI
Start by port-forwarding the Thanos Query service:
kubectl port-forward svc/thanos-query -n monitoring 9090:9090
Visit http://localhost:9090 in your browser. You should see the Thanos Query UI, which looks similar to the Prometheus expression browser.
On the Endpoints tab, verify that two endpoints are listed:
- The Prometheus Sidecar (prometheus-stack-kube-prometheus-prometheus)
The Thanos Store Gateway (thanos-store)
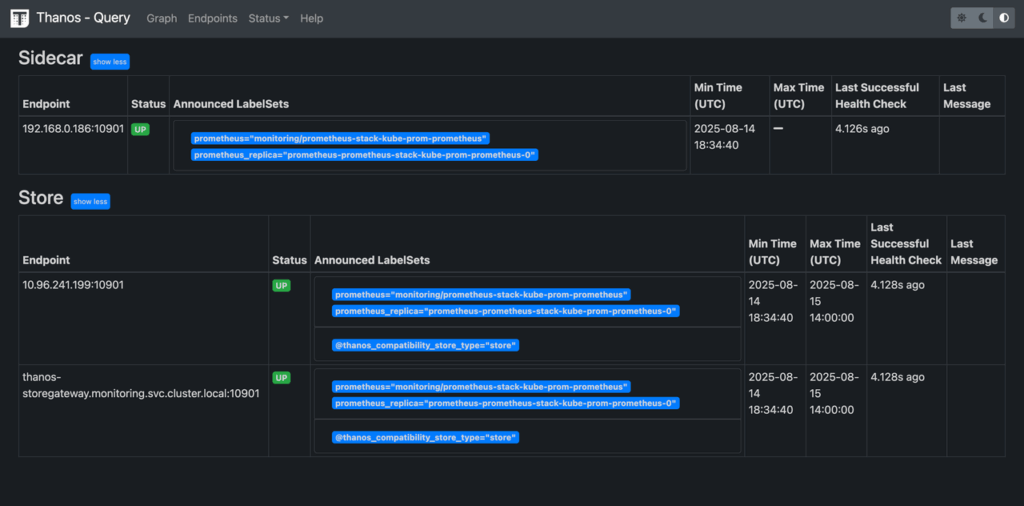
If both are present and healthy, it means your federated query setup is functional.
Checking for Successful Block Uploads
The Thanos Sidecar uploads TSDB blocks to object storage at regular intervals (usually 2 hours by default). You can check its logs to confirm successful uploads:
kubectl logs deploy/prometheus-stack-kube-prometheus-prometheus -c thanos-sidecar -n monitoring
Look for log lines like:
level=info ts=2025-08-15T09:47:57.422230553Z caller=shipper.go:334 msg=”upload new block” id=01K2NTQ05XNEN5TCNJ6VCGFE4K
This indicates that metrics blocks are being written to your UpCloud Object Storage bucket.
Check Store Gateway Access to Object Storage
Next, confirm that the Thanos Store Gateway can access those uploaded blocks. Run:
kubectl logs deploy/prometheus-stack-thanos-store -n monitoring
You should see logs that mention discovered blocks and bucket syncing:
ts=2025-08-15T09:48:22.131311006Z caller=fetcher.go:628 level=info component=block.BaseFetcher msg=”successfully synchronized block metadata” duration=302.762563ms duration_ms=302 cached=7 returned=7 partial=0
ts=2025-08-15T09:48:22.133060752Z caller=bucket.go:872 level=info msg=”loaded new block” elapsed=1.684564ms id=01K2P1JQEAYSP50GRJXKXAQSB9
If you see repeated bucket access errors like this:
Errors in credentiaLS: level=warn ts=2025-08-15T02:08:26.288428734Z caller=sidecar.go:345 err=”check exists: stat s3 object: Access Denied.” uploaded=0 in prom operator
Double-check your objstore.yml configuration and Kubernetes secret.
Query Historical Metrics
With Thanos fully deployed, you can now query metrics that span weeks or even months, far beyond what Prometheus stores locally. Start by port-forwarding the Thanos Query service and visit http://localhost:9090/
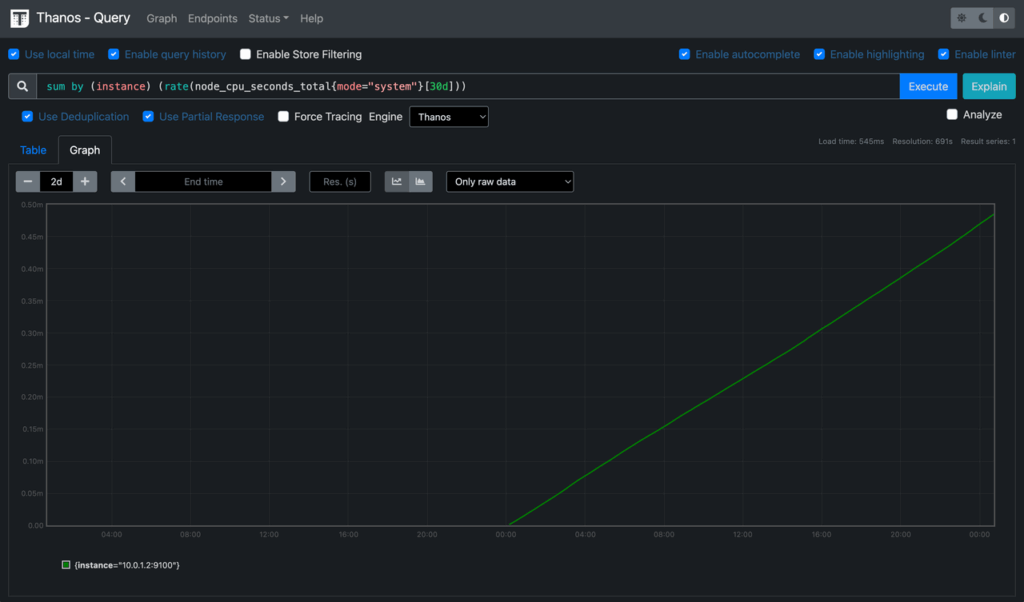
Here, set the engine to Thanos and run this long-range query:
sum by (instance) (rate(node_cpu_seconds_total{mode=”system”}[30d]))
This query shows how much time each node’s CPU spent in system mode (running kernel-level tasks) over the last 30 days, averaged per second. It’s useful for:
- Detecting nodes with consistently high system overhead
- Investigating noisy workloads (e.g., logging, I/O-heavy containers)
- Identifying infrastructure-level regressions over time
Here’s what the result graph should look like:
Integrating Thanos With Grafana
To be able to view historic data in Grafana and build dashboards with it, you’ll need to add Thanos Query as a new data source. This allows Grafana to access metrics stored in UpCloud Object Storage via the Thanos Store Gateway, while still querying recent data from Prometheus.
Add Thanos Query as a Grafana Data Source
- Visit your Grafana UI (usually via the prometheus-stack-grafana service or Ingress).
- Navigate to Settings → Data Sources → Add Data Source.
- Choose Prometheus as the type.
Set the URL to the internal service name for Thanos Query:
http://thanos-query.monitoring.svc.cluster.local:9090
- Set a name like Thanos (Long-Term) to distinguish it from your existing Prometheus source.
- Click Save & Test to validate connectivity.
You’ll receive a success message:
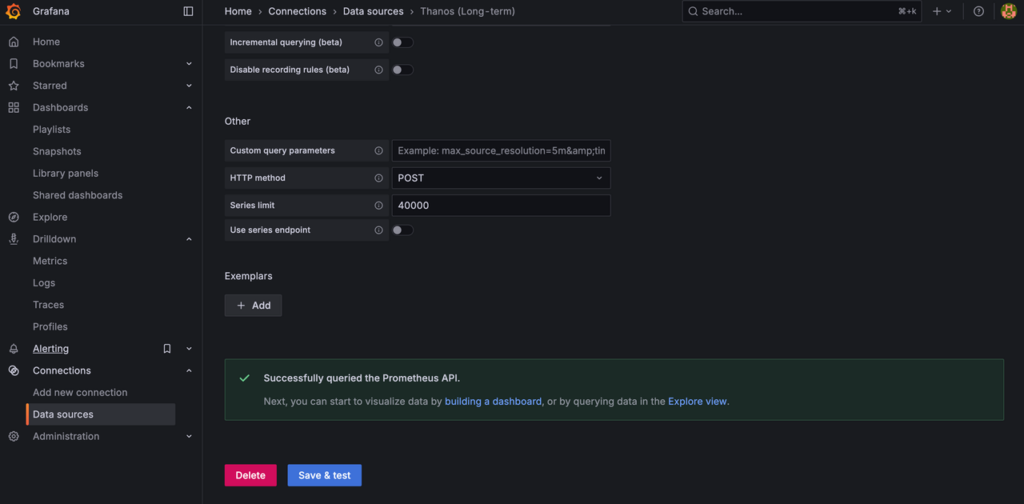
Grafana now treats Thanos Query like any other Prometheus-compatible source, but with access to downsampled metrics, block storage, and query fan-out to multiple stores.
When building dashboards, try keeping your original Prometheus data source for high-resolution, recent metrics (e.g., [5m], [1h] windows), and using the Thanos source for long time ranges ([7d], [30d], etc.) in dashboards and analysis. This lets you build dashboards that span from real-time diagnostics to historical trends without worrying about Prometheus’s native retention limits.
Conclusion
By integrating Thanos into your kube-prometheus-stack deployment on UpCloud, you’ve extended Prometheus from a short-term, single-cluster monitoring system into a resilient, long-term observability platform. Thanos unlocks durable metrics storage in UpCloud Object Storage, enabling queries across weeks or months of data; even after Prometheus has purged local blocks. It also introduces a unified query layer that can aggregate metrics from multiple Prometheus instances and storage backends, paving the way for multi-cluster observability at scale.
With this setup, your UpCloud observability stack is now complete, from infrastructure and workload metrics to custom application instrumentation, visualized in Grafana and retained for long-term analysis. You’re well-positioned to explore additional capabilities like alerting on historical trends, recording rules for efficiency, or even cross-region federation. Observability is about unlocking insights, and now you have all the tools to do just that.
Discussion