
An Introduction to OpenSearch
OpenSearch is a community-driven, open-source search and analytics suite. It is a tool that lets you store, search, and analyse large volumes of data quickly and in near real-time. It is typically used for storing items such as data from log files, but it can also handle any type of structured or unstructured data.
What you will learn in this tutorial
In this OpenSearch tutorial, we will systematically explore the various aspects of this powerful tool. The following points provide an overview of what you can expect to learn from this guide:
- Learn how to connect to an OpenSearch cluster using the provided API.
- Understand how to perform basic OpenSearch operations such as creating and deleting indices.
- Learn how to add data to an index individually and in bulk.
- Learn how to search data within an index using the OpenSearch API.
- Learn how to access OpenSearch Dashboards and interact with data in the cluster.
- Understand the concept of index patterns and learn how to create one.
- Discover how to create visually appealing dashboards and visualisations using the index pattern.
Establishing a connection
OpenSearch has a very comprehensive API which allows you to interact with your OpenSearch cluster in a simple and straightforward manner.
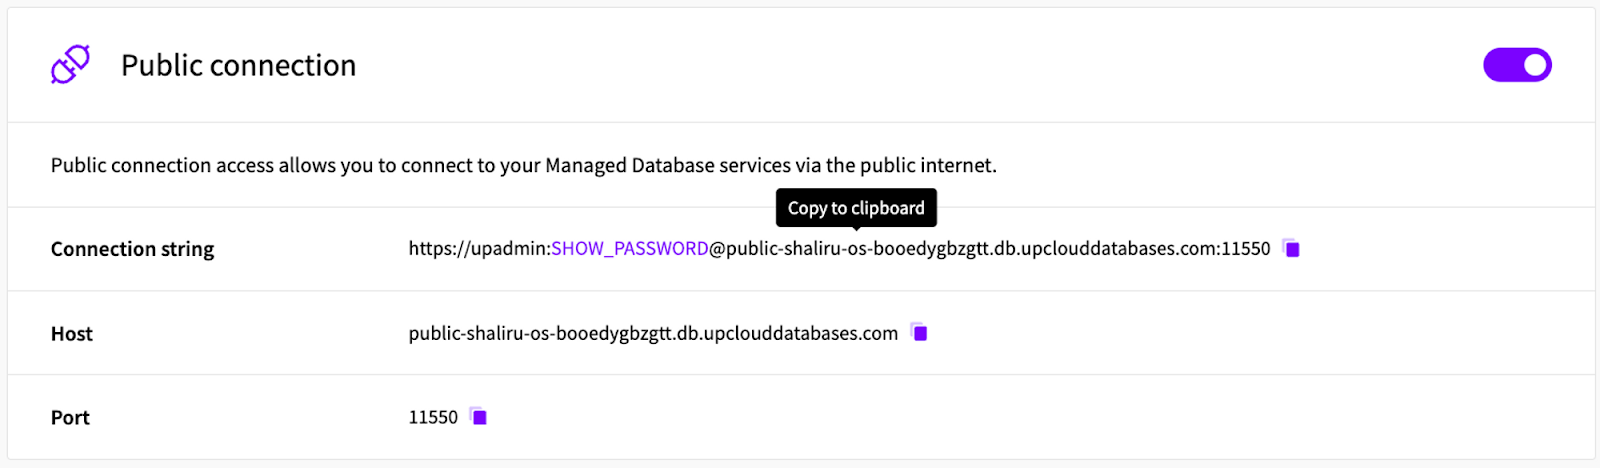
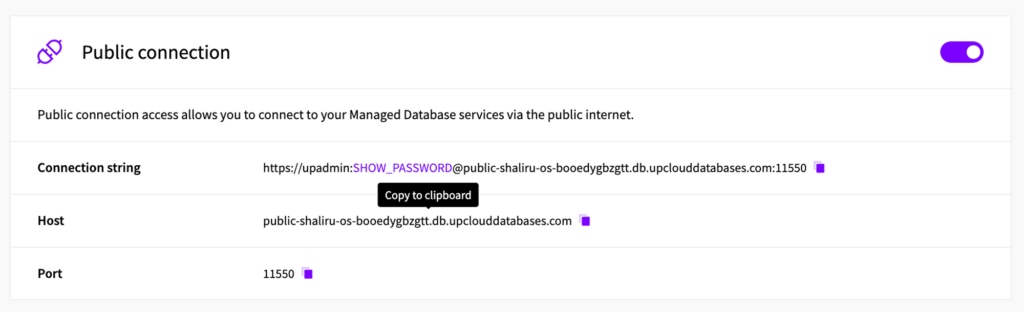
After deploying an OpenSearch cluster on UpCloud, you can see the OpenSearch API in action right away by verifying the connection with the cluster. The process is quite simple: First, you obtain your public connection string from the UpCloud hub. Then you paste this connection string directly into your API client of choice.
The connection string contains the necessary information to locate and access the database cluster, such as the hostname, port number, database name, and authentication credentials.
Sending the request will return information about the cluster and its configuration, confirming that the connection was successful.

Basic OpenSearch operations
Now let’s look at some basic operations to see how easy it is to interact with an OpenSearch cluster.
Creating an index
First, let’s create a new index within our newly created OpenSearch cluster. We’ll call the new index “movie_ratings” and we’ll also define the index mapping to include fields like “title” for the movie title, “genre” for the movie genre, and “rating” for the movie’s rating. Our index will contain two shards and one replica.
This can be done using the following OpenSearch API request:
PUT <index-name>
PUT <endpoint>movie_ratings

{
  "settings": {
    "number_of_shards": 2,
    "number_of_replicas": 1
  },
  "mappings": {
    "properties": {
      "title": {
        "type": "text"
      },
      "genre": {
        "type": "text"
      },
      "rating": {
        "type": "float"
      }
    }
  }
}

“acknowledged” in the response indicates that the index was successfully created.
To avoid the need for repeatedly entering the OpenSearch endpoint with every request, I have conveniently stored it as a variable called base_url in my API client. Going forward, I will use this variable to reference my endpoint, simplifying the process.
Listing all Indices
To confirm the creation of the new index, let’s now list the indices present within the OpenSearch cluster. This can be achieved by executing the following request:
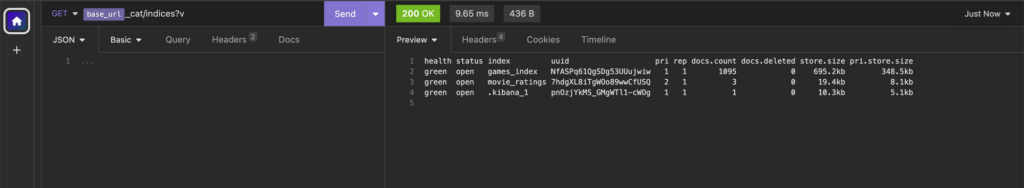
GET _cat/indices?v
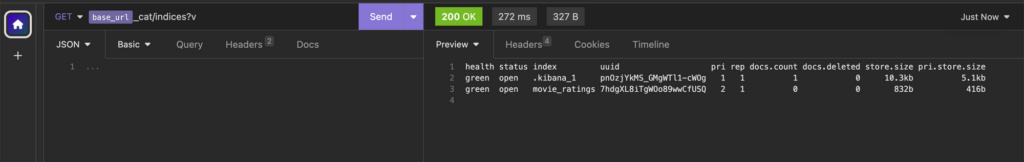
The command’s response presents a table displaying the indices within our cluster – including the new movie_rating index we just created. Below is a brief description of what each column in the table means.
- health: Represents the health status of the index, where “green” indicates that all primary and replica shards are active and assigned, “yellow” indicates that all primary shards are active and assigned but not all replica shards are active, and “red” indicates that some or all primary shards are not active.
- status: Indicates whether the index is open or closed. An open can be read from and written to, while an index that is closed cannot be accessed.
- index: The name of the index.
- uuid: The unique identifier for the index.
- pri: The number of primary shards for the index.
- rep: The number of replica shards for the index.
- docs.count: The number of documents in the index.
- docs.deleted: The number of deleted documents in the index.
- store.size: The size of the index on disk, including both primary and replica shards.
- pri.store.size: The size of the primary shards on the disk.
Whenever you list the indices in a cluster, chances are you’ll see indices that you did not create. These special indices are created automatically and usually begin with a dot, like .kibana_1, in the screenshot above. This particular index (.kibana_1) is used by Kibana, an open-source data visualisation tool commonly used with OpenSearch. Kibana stores its configuration in this index, so unless you have a specific need or understanding of its impact, you should not modify this or any other special index that was created automatically.
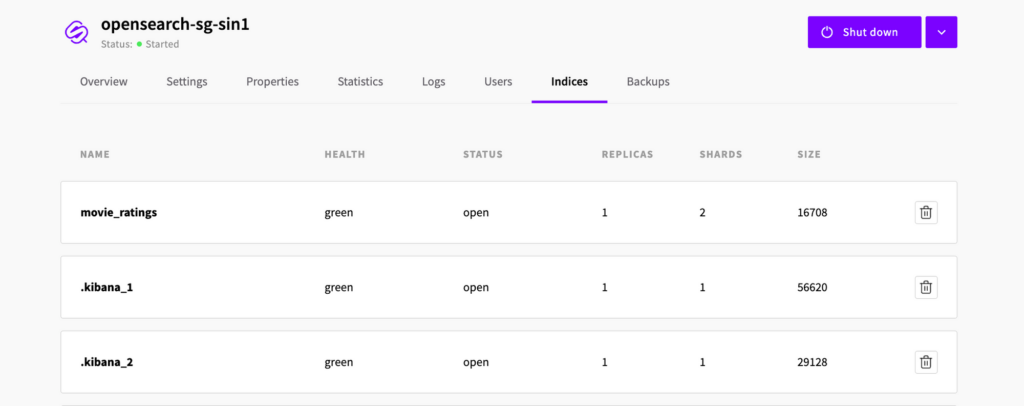
The indices in the cluster can also be viewed directly from the UpCloud Hub, under the Indices tab.
Adding data to our index
You should now have a newly created empty index called movie_ratings. However, before you can search it for data, you must first add data to it. This data is known as documents, and the process of adding documents to an index so that it is searchable is known as indexing.
To index a single document, use the request below:
POST <index-name>/_doc
The body of the request contains the document data itself. In the example below, the document consists of a single record that includes the movie title, its genre, and its respective IMDb rating. It would appear as follows:
POST <endpoint>movie_ratings/_doc

{
  "title": "The Shawshank Redemption",
  "genre": "Drama",
  "rating": 9.3
}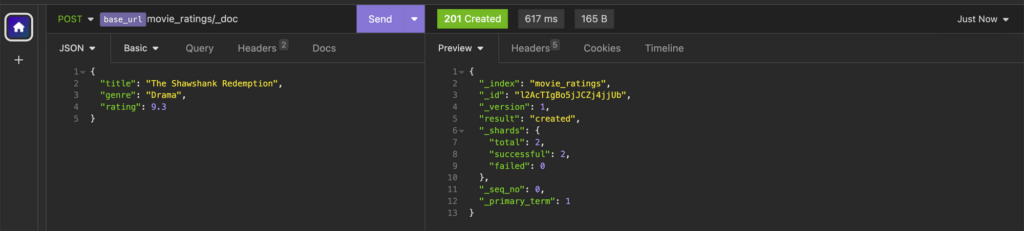
The response returned by OpenSearch confirms that the document was successfully indexed. Below is an explanation of what some of the attributes in the response mean.
Adding data in bulk
Let’s now add a couple more documents to our collection of movies. However, this time we’ll use the _bulk API endpoint to add them simultaneously.
POST _bulk
POST <endpoint>_bulk

{ "index" : { "_index" : "movie_ratings" } }
{ "title" : "Inception", "genre" : "Action", "rating" : 8.8 }
{ "index" : { "_index" : "movie_ratings" } }
{ "title" : "Pulp Fiction", "genre" : "Crime", "rating" : 8.9 }
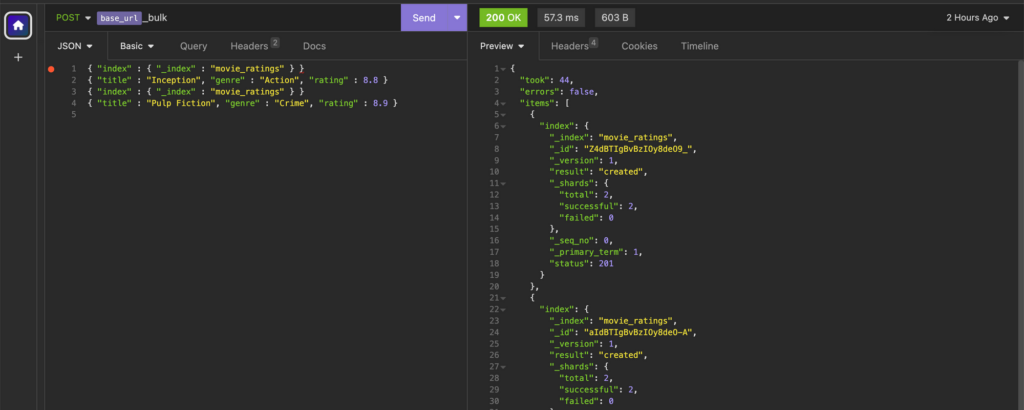
The two new documents mean our index now has three documents in total. While an index with a mere three documents is manageable, OpenSearch is designed to handle much larger indices – with hundreds of thousands of documents.
Using the methods from earlier to index such large datasets is time-consuming and inefficient. So, another approach is needed here; Ingestion.
Ingestion refers to the process of gathering and indexing data from various sources, such as log files, databases, etc, into OpenSearch. However, the data in these files are usually in a format that cannot be used directly by OpenSearch through an API client, as demonstrated in the previous example. The data often needs to be parsed and formatted correctly so that it can be properly indexed. This may involve extracting fields from log messages, converting timestamps to a standard format, or other data transformation tasks. Once the data is properly formatted, it can then be indexed, which involves adding it to the OpenSearch database in a way that allows it to be searched. In some cases, additional data can be added during the ingestion process to provide more context or to make the data more useful. For example, if you’re indexing web server logs, you might add geographic information based on the IP addresses in the logs.
To see this in action, we will ingest a list of computer games into our OpenSearch cluster.
The dataset to be ingested is from a CSV file that contains the records of about a thousand computer games. You can find and download the same dataset from Kaggle – https://www.kaggle.com/datasets/iamsouravbanerjee/computer-games-dataset
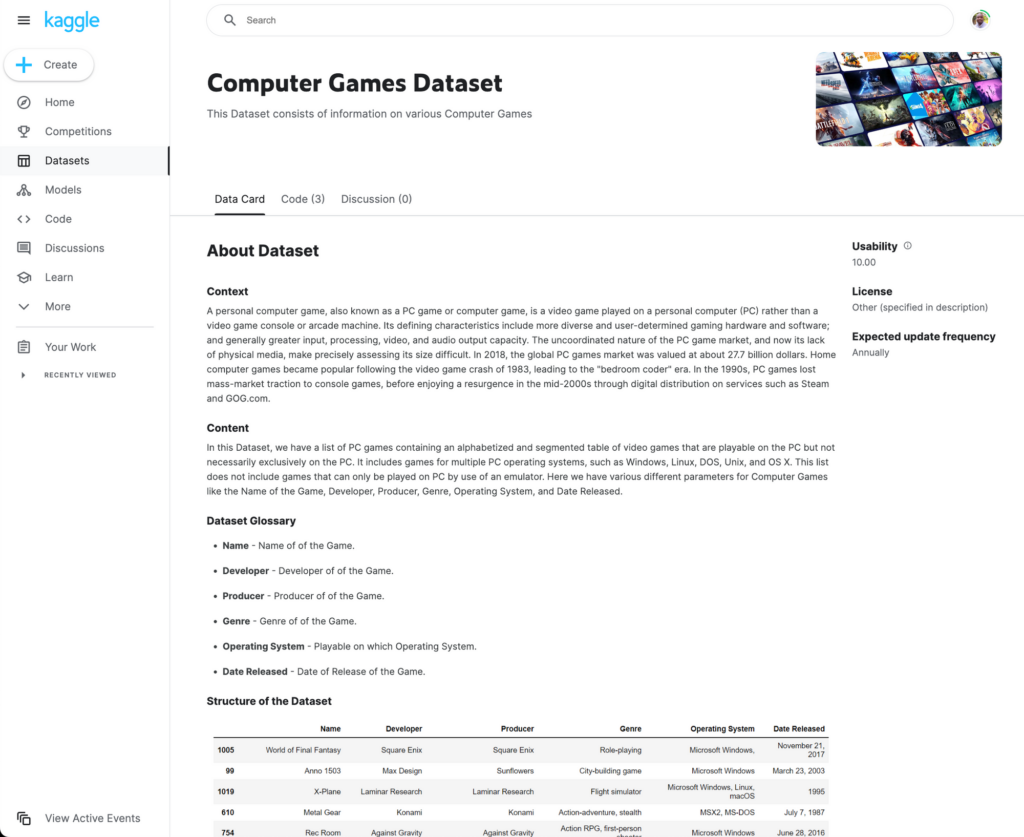
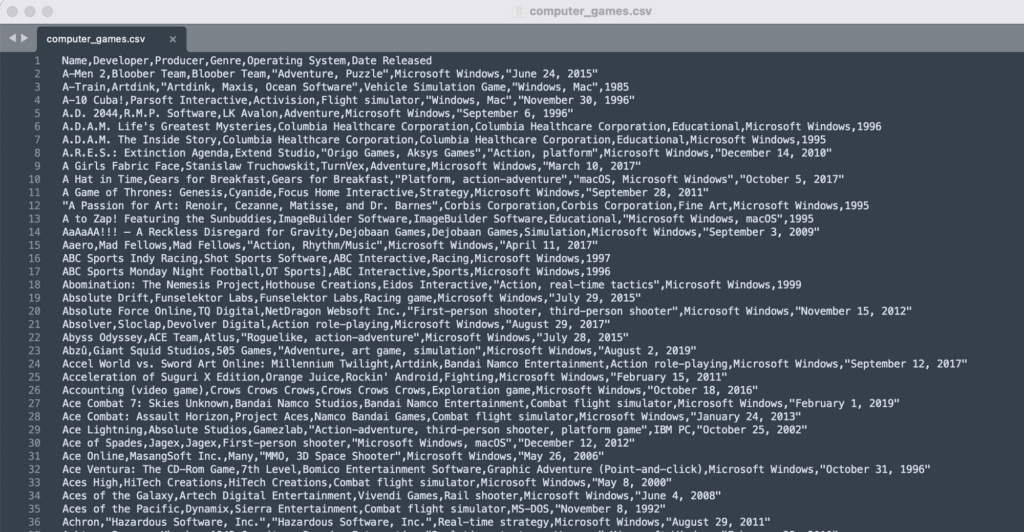
The file is a typical CSV file where the first row is a header that contains six fields: Name, Developer, Producer, Genre, Operating System, and Date Released.
Before we can use this data in OpenSearch, we first need to convert the CSV data to JSON format. There are various ways to do that, but for the purpose of this guide, we’ll be using a free online conversion tool which can be found at the link below:
https://www.convertcsv.com/csv-to-json.htm
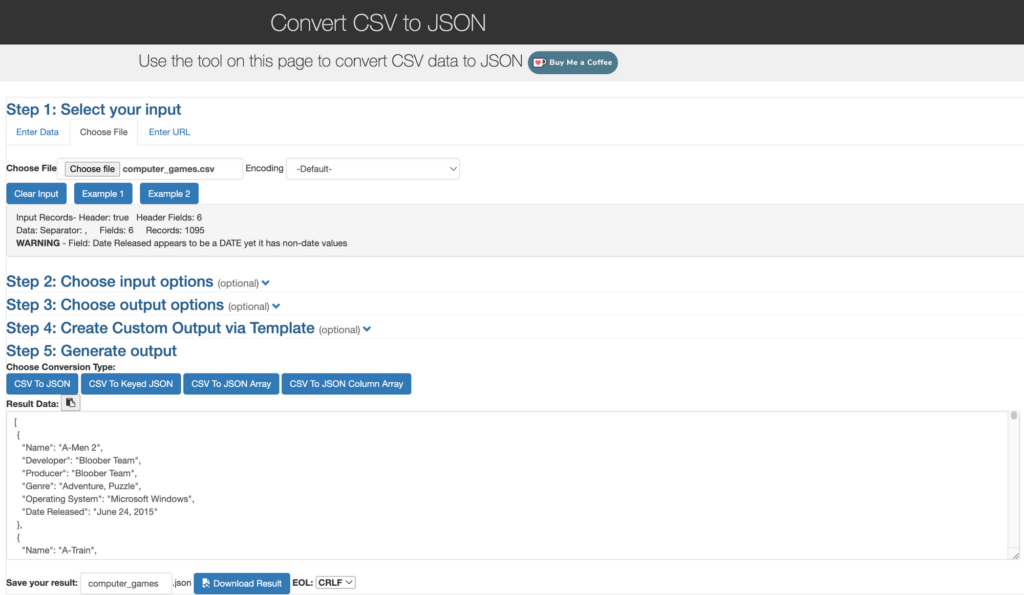
After converting the data from the CSV file into JSON format, we can proceed to index it into our OpenSearch cluster. Thanks to the open-source nature of OpenSearch, clients are available for a wide range of platforms and programming languages. You can find these clients at the following link: https://opensearch.org/docs/2.7/clients/index/
For simplicity, we’ll use a basic Python script that reads the data directly from our saved JSON file. A copy of the script can be found below:
import requests
import json
# URL of our OpenSearch instance
url = '<endpoint>games_index/_doc/'
# Our OpenSearch credentials
credentials = ('<username>', '<password>')
# JSON data into a Python data structure
with open('computer_games.json', 'r') as f:
data = json.load(f)
# If data is a dictionary (i.e., single JSON object), wrap it in a list
if isinstance(data, dict):
data = [data]
# For each document...
for doc in data:
# POST the document as JSON to the OpenSearch instance, using our credentials
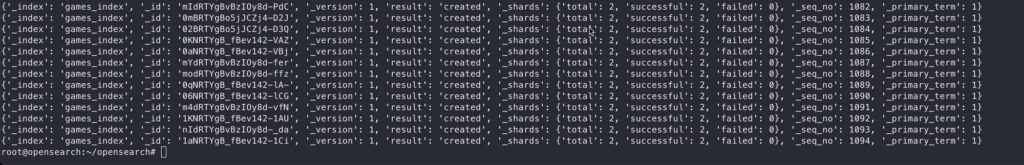
response = requests.post(url, json=doc, auth=credentials)
# Print the response from OpenSearch
print(response.json())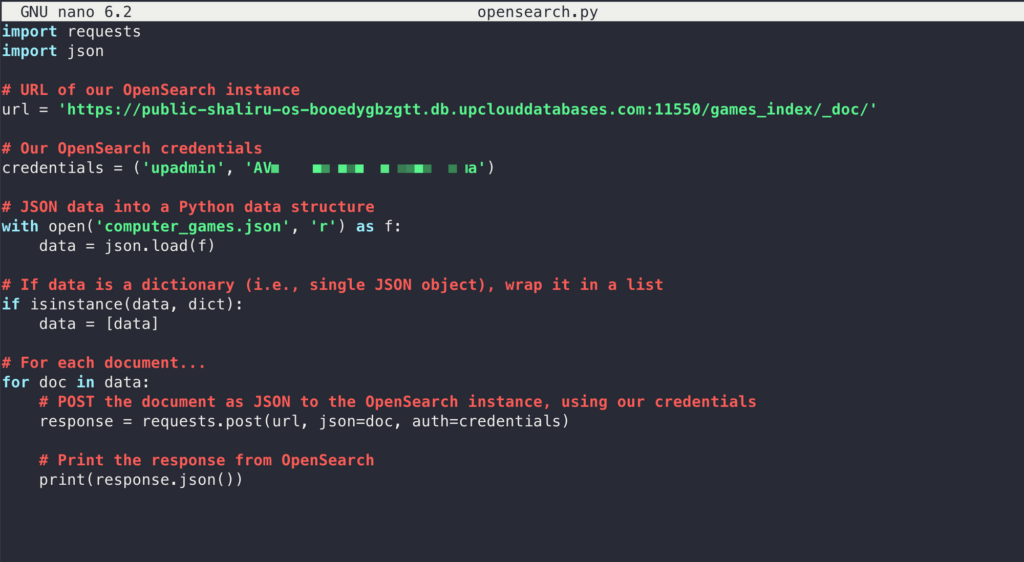
The Python script above reads JSON data directly from the file which we converted from a CSV file earlier. However, there is no reason why the same Python script can’t be modified to include a function to do the CSV to JSON conversion. Below is a modified version which does just that.
import requests
import csv

# URL of our OpenSearch instance
url = '<endpoint>games_index/_doc/'

# Our OpenSearch credentials
credentials = ('<username>', '<password>')

# Read CSV data into a Python data structure
with open('computer_games.csv', 'r') as f:
    reader = csv.DictReader(f)
    data = [row for row in reader]

# If data is a dictionary (i.e., single CSV object), wrap it in a list
if isinstance(data, dict):
    data = [data]

# For each document...
for doc in data:
    # POST the document as JSON to the OpenSearch instance, using our credentials
    response = requests.post(url, json=doc, auth=credentials)

    # Print the response from OpenSearch
    print(response.json())
Running either script adds the data from the file into our OpenSearch cluster in a new index called games_index which was specified in the script.
Using the request from earlier to list our indices, we can see the newly created index in the OpenSearch cluster. The docs.count column indicates that the new index has a total of 1095 documents within it, ready to be searched.
Searching the Index
OpenSearch offers a flexible search language known as the query domain-specific language (DSL), which allows us to effectively search through our data using a JSON interface. This makes it ideal for querying data via the OpenSearch API.
With query DSL, you need to specify a query in the query parameter of the search. One of the simplest searches in OpenSearch uses the match_all query, which matches all documents in an index. This is useful for listing all the documents contained in our index. Let’s give that a try.
GET <index-name>/_search
GET <endpoint>movie_ratings/_search

{
  "query": {
    "match_all": {}
  }
}
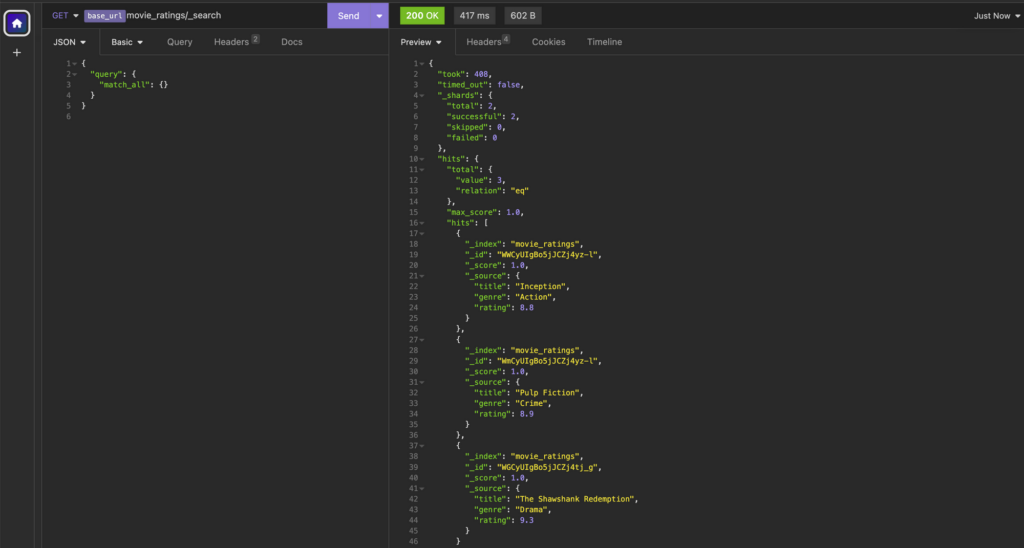
The response returned lists of all the documents found in our index. In addition to details that we created like title, genre, and rating, each document entry also includes additional attributes such as the index name (_index) and a unique document ID (_id) which is specific to that document.
To perform an actual search of the index, we can use the same search request from earlier, only this time, we modify the request’s body slightly to indicate what we’re looking for, like this:
GET <index-name>/_search
GET <endpoint>games_index/_search

{
    "query": {
        "query_string" : {
            "query" : "rock"
        }
    }
}
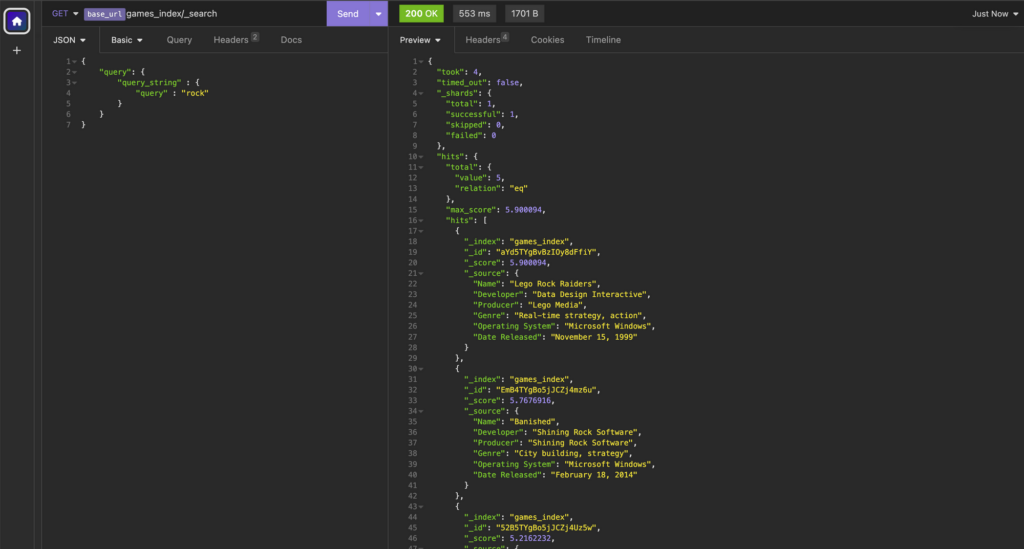
In the example above, we searched for the term “rock”, which resulted in a list of matching documents referred to as “hits.” These hits represent documents within the index that contain the search term within any field. For example, the first hit has the word rock in the Name field, while the second hit has the word rock in the Producer and Developer fields.
But what if we want to do a more specific search, such as limiting the hits to only the “Name” field? We can achieve that by modifying the search request to specify the fields we want to restrict the search to. Here’s an example of how that would look:
GET <endpoint>games_index/_search

{
  "query": {
    "match": {
			"Name": "rock"
		}
  }
} 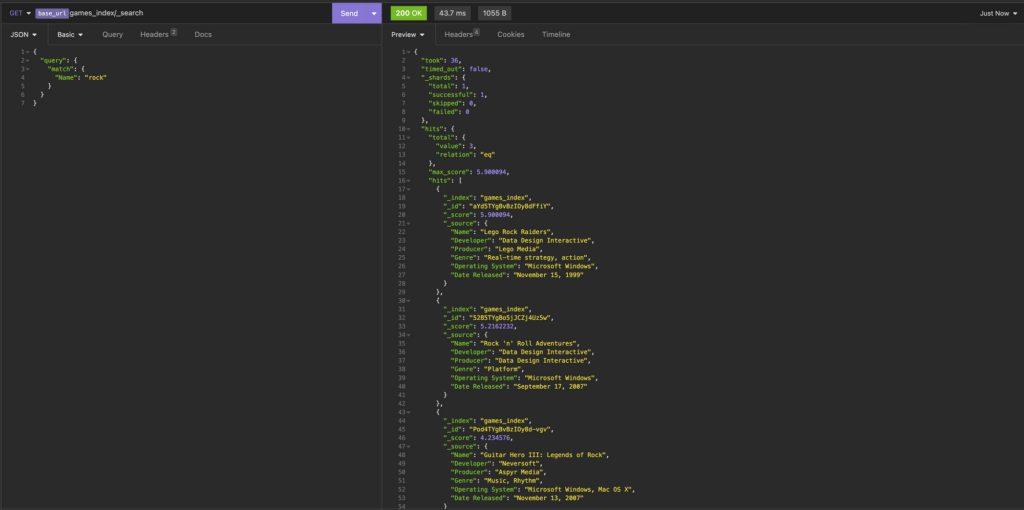
The modified request now only returns hits that contain the word rock within the “Name” field. Hits containing the term “rock” in fields other than the “Name” field are excluded from the results.
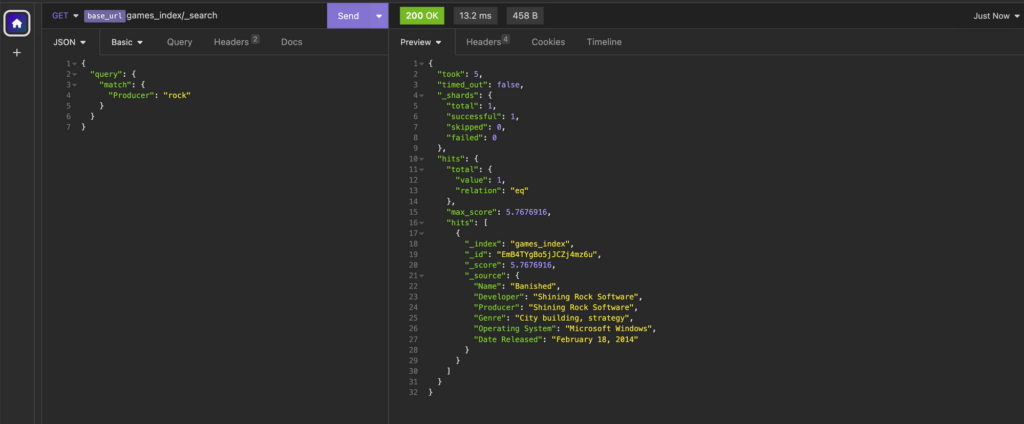
Had our goal been to search within the “Producer” field, then our request would have looked like this instead:
GET <endpoint>games_index/_search

{
  "query": {
    "match": {
			"Producer": "rock"
		}
  }
}
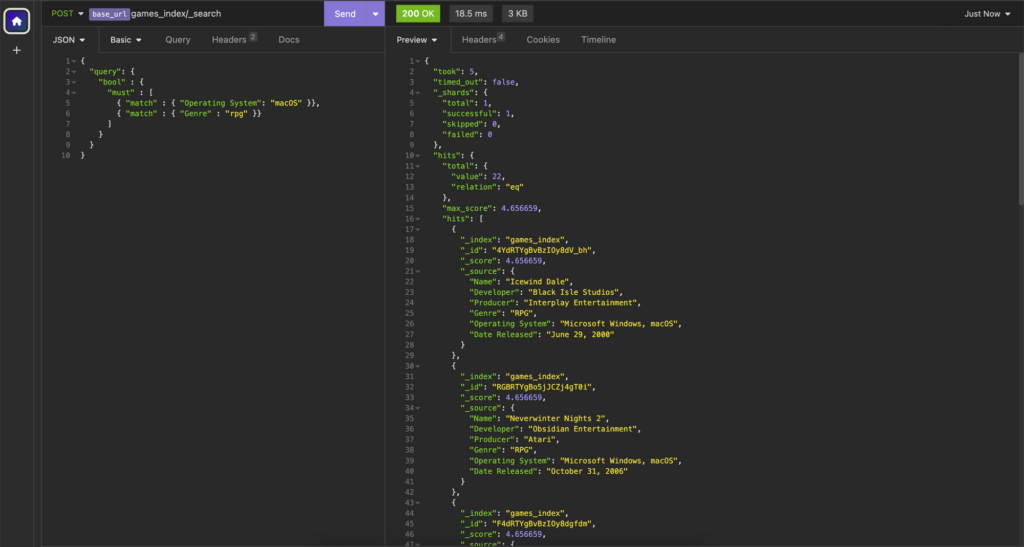
It is also possible to use the bool query within the request body to restrict our search to multiple fields within the same search. This is super useful for making very specific searches. For example, if we want to find RPG games that can be played on macOS from our index, we could make a request like this to restrict our search to only documents that match both criteria.
GET <endpoint>games_index/_search

{
  "query": {
    "bool" : {
      "must" : [
        { "match" : { "Operating System": "macOS" }},
        { "match" : { "Genre" : "rpg" }}
      ]
    }
  }
}
Querying data is a significant part of OpenSearch, making it a very broad topic that, unfortunately, is beyond the scope of this guide. If you’re interested in learning more about how to effectively query data using the OpenSearch API, I highly recommend referring to the OpenSearch documentation on the topic: https://opensearch.org/docs/2.7/query-dsl/
Delete an index
Removing an index is quite straightforward. We simply initiate a DELETE request to the specific endpoint corresponding to the index we wish to delete.
DELETE <index-name>
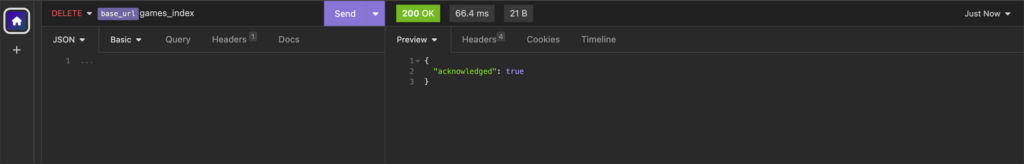
The response confirms that the delete operation was successful.
The OpenSearch Dashboard
Earlier in this guide, we discussed the steps involved in creating an OpenSearch index and the process of ingesting data into it. We also provided a brief overview of querying this data using the OpenSearch API.
But you may be asking yourself: How useful is all this data in our OpenSearch cluster if it can only be accessed through an API, with results given back in JSON format?
This is where OpenSearch Dashboards come in.
OpenSearch Dashboards is a powerful tool that complements the OpenSearch API by providing a user-friendly interface for visualising and analysing the data stored in an OpenSearch cluster.
Accessing OpenSearch Dashboards
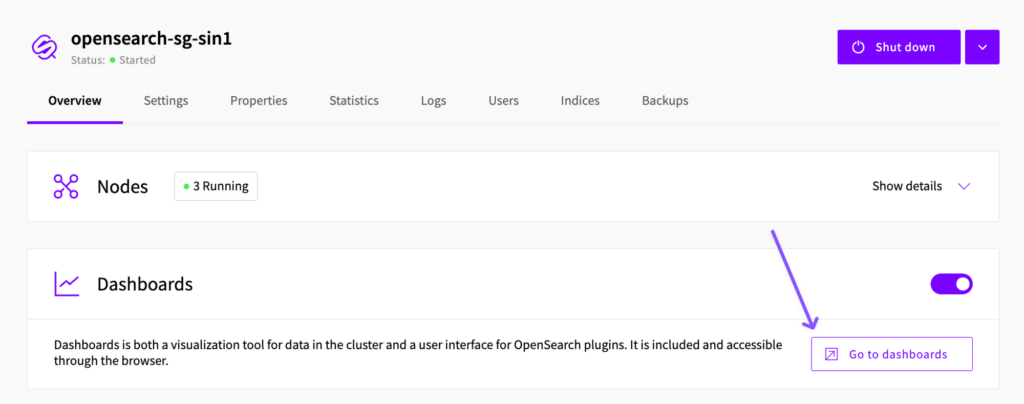
OpenSearch Dashboards can be accessed directly from the UpCloud Hub in the OpenSearch cluster overview tab. Clicking the “Go to dashboards” button will open the dashboard in a new tab.
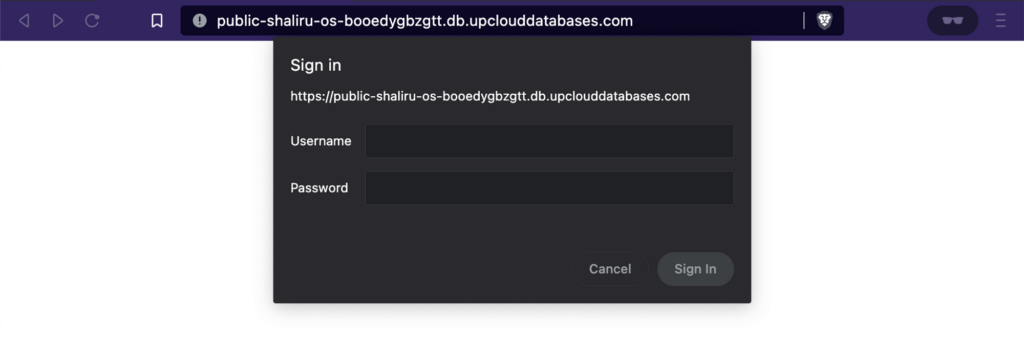
It is also possible to access the dashboard using your cluster’s public host, assuming public access is enabled. When using this method, you will be prompted to enter the cluster’s credentials before accessing the dashboard.
Index patterns
An index pattern is a way to designate the indices we want OpenSearch Dashboards to examine when running a search or query. This simplifies our work because instead of specifying the exact index or list of indices each time we want to explore data or create a visualisation, we can just specify the index pattern.
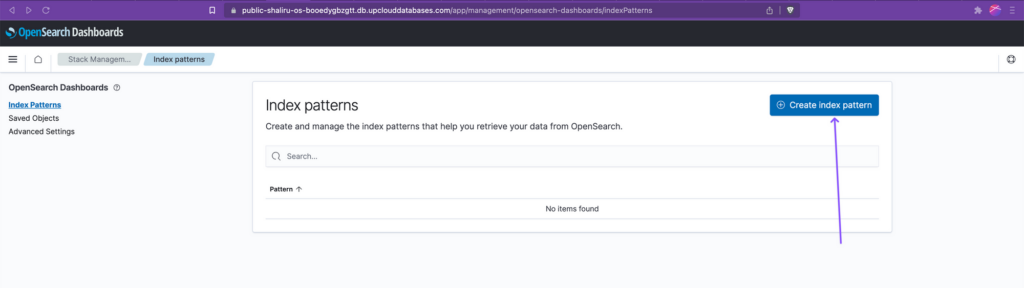
To create an index pattern, open the left-side navigation pane, and click “Stack Management”, followed by “Index patterns”. Then click the “Create index pattern” button.
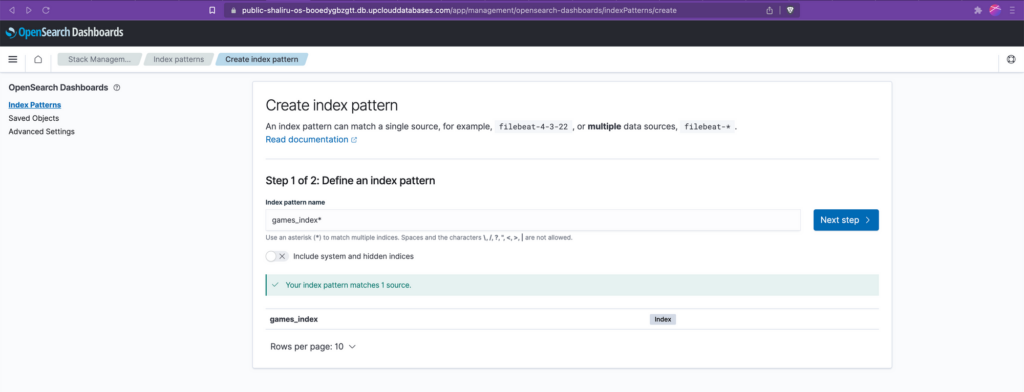
The next step involves establishing a pattern that allows us to specify the indices we wish to include in our index pattern. One option is to use an asterisk (*) as a wildcard character, enabling us to select all available indices. However, in our case, we only want to select a single index. So, we simply enter the complete name of the index and then click “next” to finalise the creation of the index pattern.
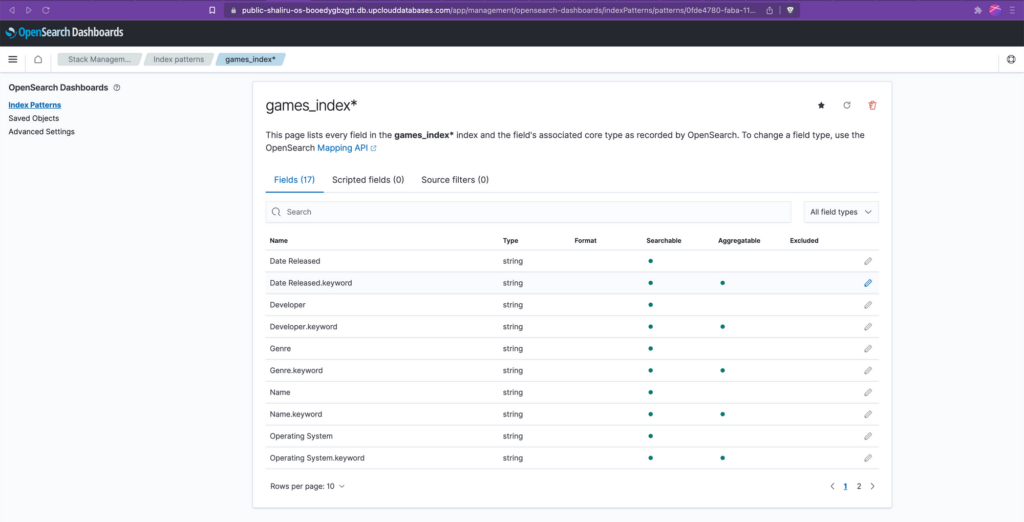
The last page on the creation screen lists all the fields within the newly created index pattern. You’ll notice some entries ending in .keyword. This is the result of the default dynamic mapping settings in OpenSearch. For text fields, this generally means that two versions of the field are created within our index pattern:
<fieldname>: This is the analysed version of the field. It’s broken down into individual terms (which are roughly equivalent to words), and each of these terms can be searched independently. This is useful for full text search.
<fieldname>.keyword: This is the not-analysed version of the field. It is a single term exactly as it was provided, useful for sorting, aggregations, and exact value searches. It also allows for efficient “term” queries, which match the exact value of the field.
Let’s say we have a field named “colour” with the value “Dark Blue”. In the analysed “colour” field, this would be broken down into two terms, “Dark” and “Blue”. If you searched for just “Blue”, this document would be a match. However, in the <fieldname>.keyword field, the value is a single term, “Dark Blue”. If you searched for just “Blue” in this field, it wouldn’t be a match.
This strategy of using <fieldname> and <fieldname>.keyword allows us to perform both full-text searches and exact value operations on the same textual data.
Interacting with the data
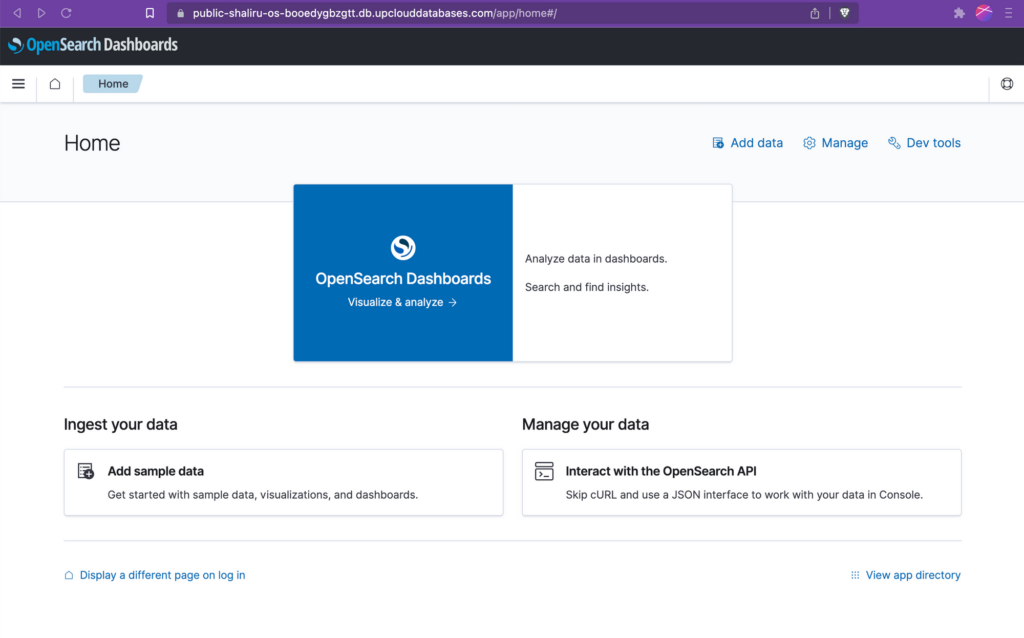
With the index pattern created, we can now interact with our data in the cluster. To do this, head back to the OpenSearch Dashboards home page and click “Visualize and analyze”. Then click “Discover”.
The Discover page on OpenSearch Dashboards provides a UI to explore and interact with the data stored in your OpenSearch cluster. It offers a search and visualisation interface where you can execute queries and view the results in real-time. Give it a try by entering a search term in the search box!
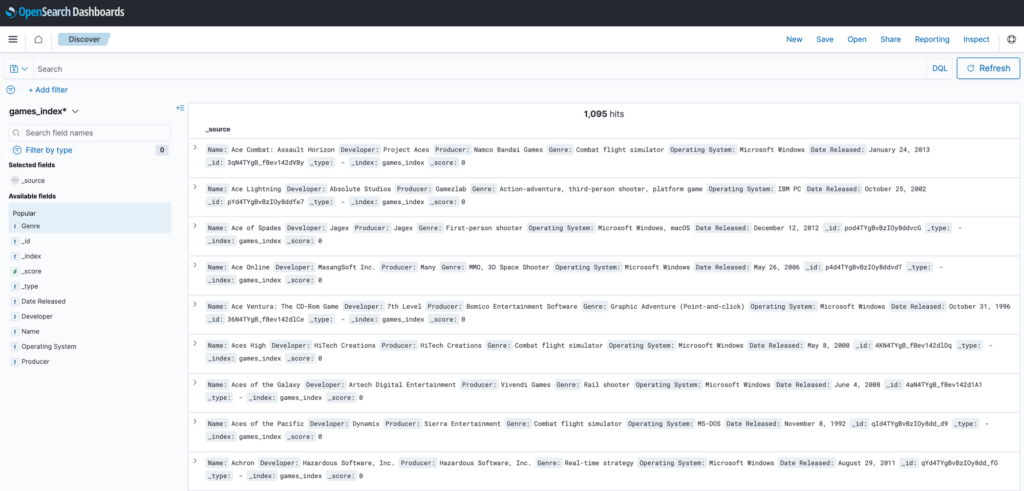
In OpenSearch Dashboards, you can perform basic searches to find data within the cluster. However, it also offers an enhanced filtering capability called Dashboards Query Language (DQL). DQL is a user-friendly, text-based query language specifically designed for filtering and retrieving data within OpenSearch Dashboards. By utilising DQL, you can easily construct more advanced queries to precisely narrow down and filter your data, enabling you to retrieve the specific information you need. More information about DQL can be found in the official documentation linked below: https://opensearch.org/docs/latest/dashboards/discover/dql/
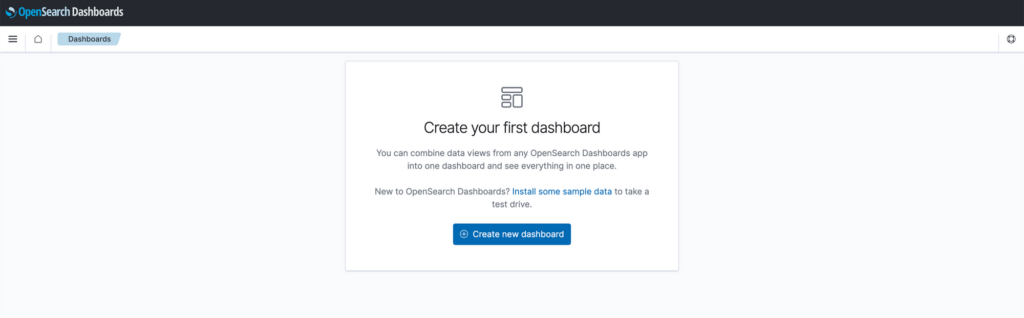
Dashboards and visualisations
With our data now organised into an index pattern, we can use the index pattern to create visually appealing dashboards and visualisations that effectively convey the information within it. To do so, we simply need to access the side panel and select the “Dashboards” option. From there, click on the button to create a new dashboard.
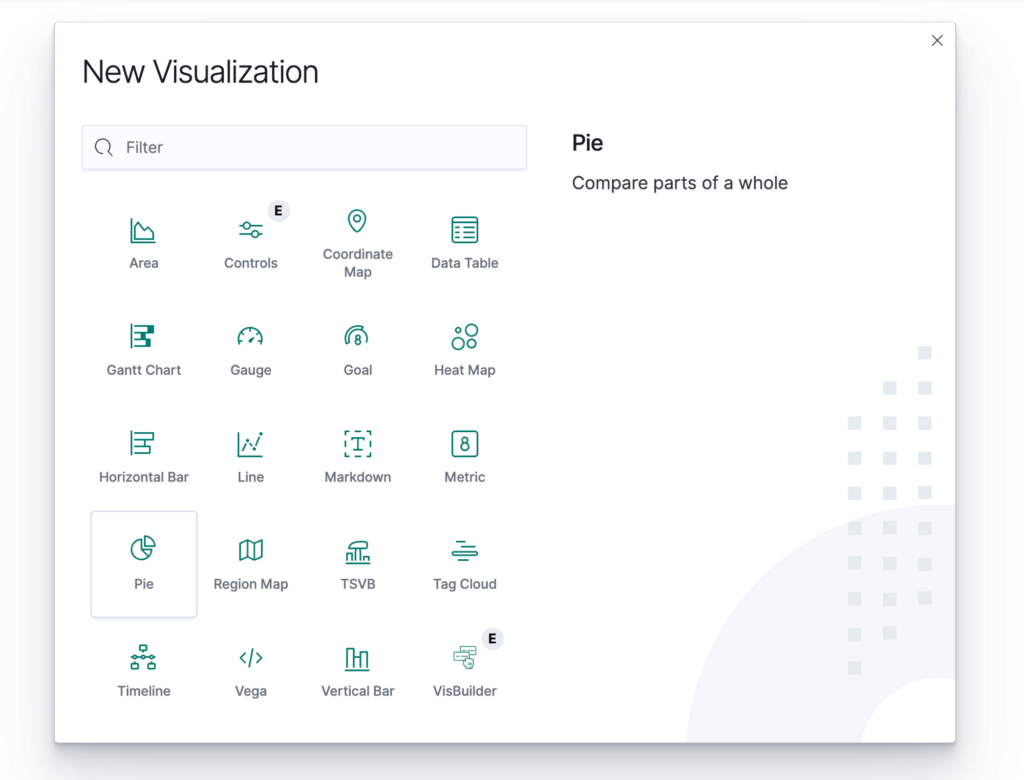
The choice of visualisation here depends on the specific information you aim to communicate. For this demo, we will opt for simplicity and use a pie chart to display the distribution of different categories within our dataset. However, I highly recommend exploring other visualisations at your own pace to discover what works best for your data and your needs.
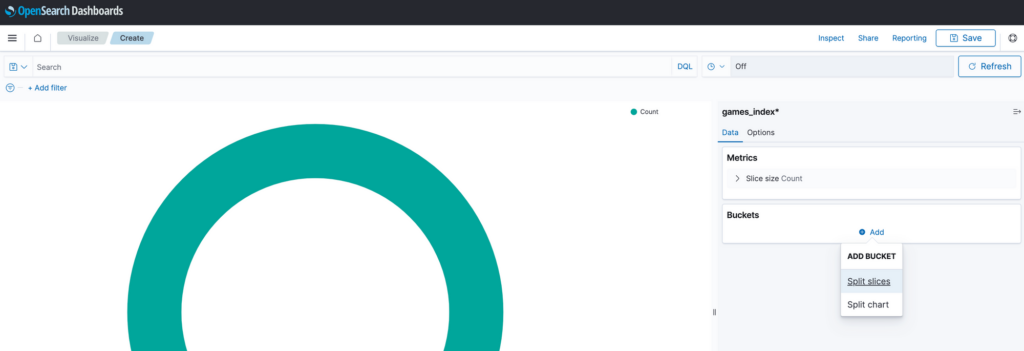
By default, and without any configuration, the pie chart displays a count of all the data inside our index. At this stage, the visualisation is not very useful.
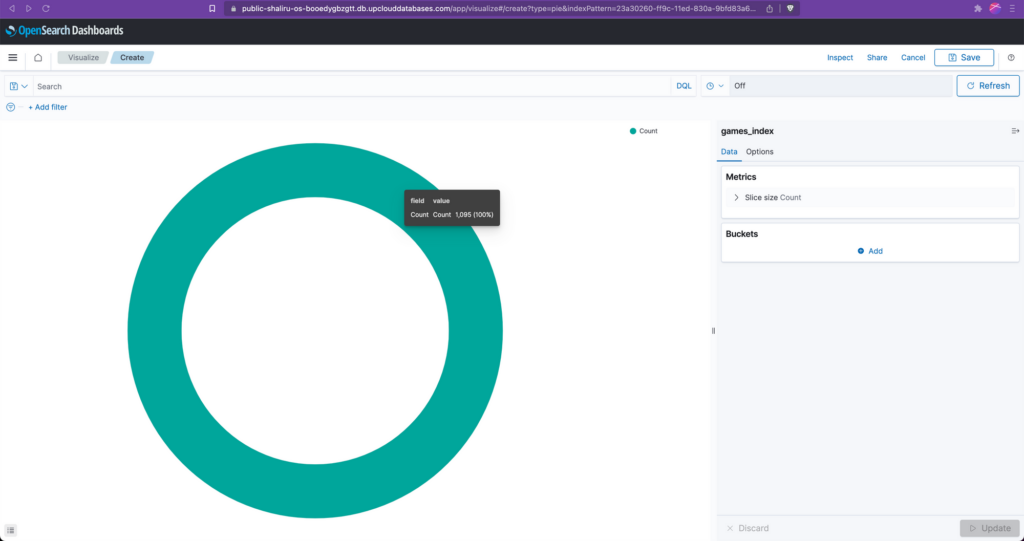
To make the data more meaningful, we must tell OpenSearch what we want it to visualise. For example, to have the pie chart display a breakdown of the top 50 game producers from our dataset, we need to tell open search that this is what we want to see. We do this by adding a new bucket and selecting “Split slices”.
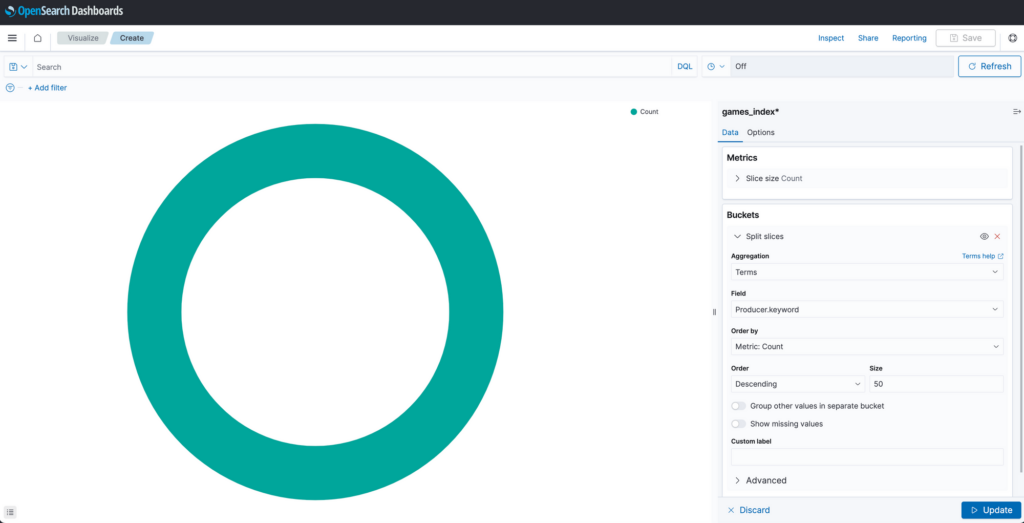
Next, under Aggregation, we select Terms. This instructs OpenSearch to craft our pie chart so that each distinct category (or ‘Term’) represents a segment within the pie chart.
Since our goal is to compile a list of producers, this will be our Term, so we must select that as the corresponding field from the available options in the field dropdown box. Additionally, to ensure that the pie chart displays only the top 50 producers, we must set the size to 50.
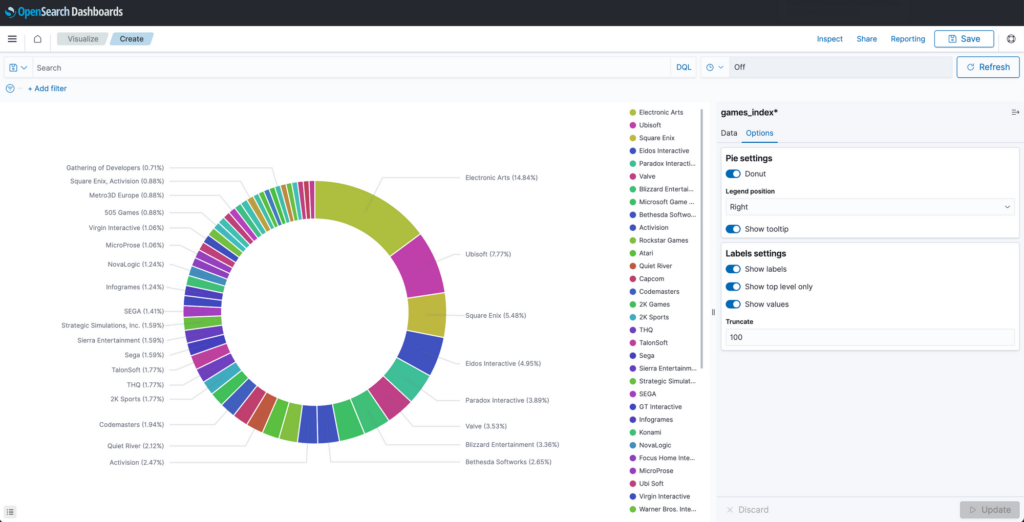
Clicking update will result in a pie chart like the one below. We can customise it further by clicking the options tab and selecting things such as labels and the type of pie chart to display.
Once saved, the visualisation object is now ready to be added to a dashboard. Do this by heading to the dashboard page and clicking the text that says “Add an existing object to this dashboard”.
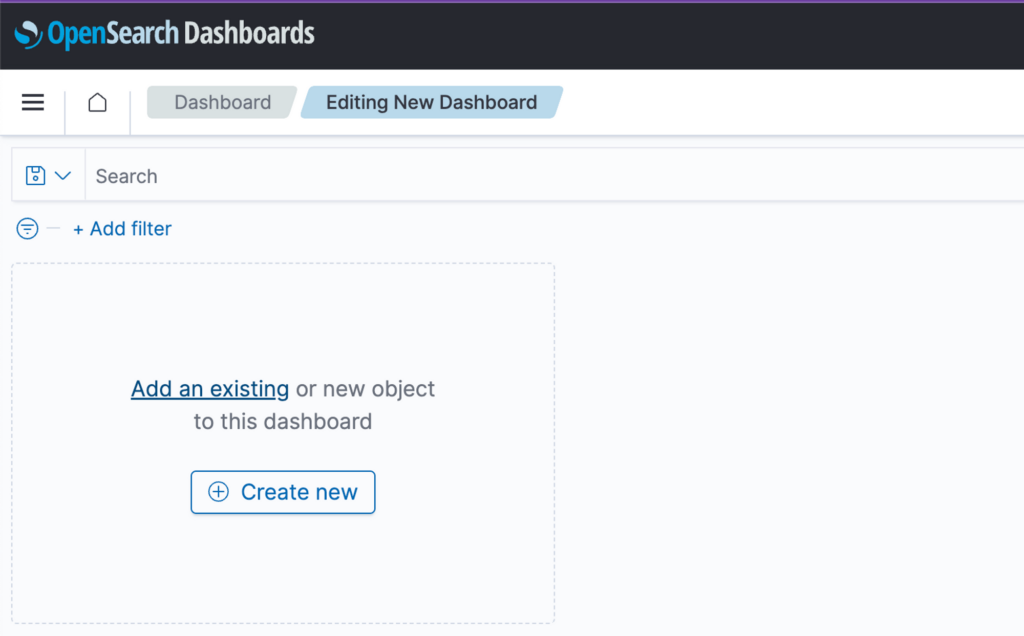
This will place the newly created visualisation on the dashboard.
You can repeat the process described above to add as many visualisations as you want to a dashboard to display various types of information from your index. When done, be sure to save the dashboard before exiting.
Depending on the nature of the data, it is possible to generate various visualisations and dashboards that can transform your dataset into valuable and enlightening information. There are multiple excellent sources available for accessing open data, and I highly encourage you to explore and experiment with them. Here are a few free sources you can use:
- Kaggle: You can visit https://www.kaggle.com to access a wide range of datasets and engage in data-driven projects and competitions.
- Data.gov: Another valuable resource is https://data.gov/, where you can discover a diverse collection of open data sets provided by various government agencies.
Enjoy exploring the possibilities!
Conclusion
In this guide, you’ve learned how to ingest data from a file into a cluster and how to explore that data using OpenSearch Dashboards.
However, while the methods covered here are helpful for learning purposes, it’s important to understand that in typical production setups, data is often streamed directly from remote applications or servers into OpenSearch – providing a continuous flow of data for real-time analysis and decision-making.